


Consumer Deleveraging: the New “wall of worry”
Economics / US Economy Jun 21, 2010 - 01:38 AM GMTBy: Clif_Droke

 Everywhere one turns it seems that fear lurks just behind the corner, just waiting to pounce. Every day we’re bombarded by fear in the news headlines, be it from a financial, economic or geopolitical perspective. Nowhere is this more apparent than the current fear campaign over the U.S. debt situation, specifically, consumer deleveraging.
The Wall Street Journal recently published a commentary on consumer deleveraging. The article pointed to the sluggish job growth trend in spite of a bounce-back in corporate earnings and assigned the principle blame for this on consumer debt-cutting. The Fed announced earlier this week that consumer credit outstanding fell by $1 billion in April to $2.45 trillion, representing the 17th monthly decline in the past two years. WSJ points out that this is an unprecedented record in the 67-year history of the data set. "Just getting debt down to 18%," says the WSJ, "would require households to shed an additional $1.4 trillion of debt."
Predictably, most economists are pessimistic on the prospects for a rebound in consumer spending. The major tool of the economist, linear extrapolation, leads most to assume that the consumer spending decline can only continue into the future, ad infinitum. "We've only just started the correction process," MFR Chief U.S. Economist Joshua Shapiro was quoted by WSJ as saying. Shapiro told WSJ he expects consumer spending to grow at only a 2.5% pace in the second half of this year and 2% in 2011.
The long-term graph of the consumer credit trend is fairly typical of where we are in the economic long wave, as well as the long-term Kress Cycles. As you can see, consumer credit outstanding peaked in the third quarter of 1984, which was exactly when the final 60-year Kress Cycle (the second one of the 120-year series) peaked. Since then, the long-term deflationary trend can be clearly seen in the consumer credit outstanding chart, which has made a series of lower highs and lower lows since the 1984 peak.
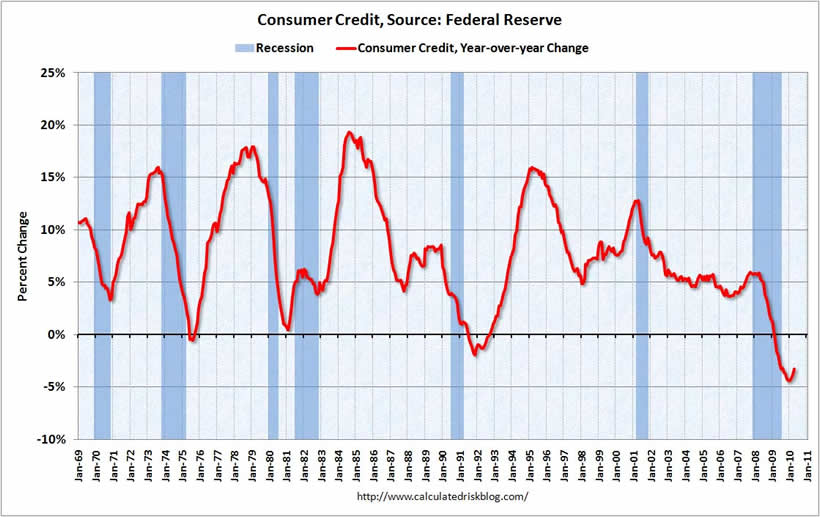
The long-term consumer credit trend also tends to fall precipitously during economic recessions, as you can see in the above chart. It tends to reverse higher following a recession and as you can see, the consumer credit trend has started to turn up since the beginning of this year.
The WSJ article did make one prescient qualifying statement that, in my opinion, is probably the most likely outcome in the debt conundrum and one that analysts consistently understate, viz. debt repudiation. "Of course," writes WSJ, "it has rarely been wise to bet against the resiliency of the U.S. consumer. After all, many households are shedding debt now simply by defaulting on it." Of this we'll have more to say later on.
"A rebound in home prices or a rally on Wall Street," concludes WSJ, "could give consumers a boost via the so-called wealth effect."
The “wealth effect” this article refers to is more likely to come from the rebound in stock prices. The widespread fears over debt levels and consumer deleveraging have acted as a pillar for the stock market’s “wall of worry” and should continue to do so. This high level of fear is being translated into a high short interest and put-call ratio in which the percentage of bears outnumbers the bulls. In a market which enjoys a rising interim trend, this high level of bearish sentiment tends to catalyze short-covering rallies at critical junctures, particularly when fear is at a heightened level.
Another piece of news that crossed the financial news wires this week concerned the slowdown in mortgage delinquencies insured by the Federal Housing Administration. According to Monday's Wall Street Journal, home mortgages insured by FHA are falling into delinquency at a slower rate than they have in the past. If the trend is maintained, according to the WSJ, it could help the government agency avoid taxpayer bailout. April, the month for which the latest figures are available, was the third consecutive month in which delinquencies declined.
Also worth mentioning is that the number of loans that were 90 days or more past due at Fannie Mae and Freddie Mac fell in March for the first time in three years. Quoting from WSJ, "Last month, the Mortgage Bankers Association said that nationally, the number of loans that were 90 days or more past due fell to 9.54% at the end of March, from 9.67% at the end of 2009."
Lest you think a piece of seeming good news like this would be treated as such without qualification, WSJ was quick to add, "But even if the recent improvements continue, the mortgage market will remain troubled for some time because delinquencies are stabilizing at a horrendously high level....Banks have so many delinquent loans that it could take years to clear them out. An estimated 4.9 million borrowers were 90 days or more past due in foreclosure at the end of March, up from 3.7 million one year earlier, according to MBA's quarterly survey."
Here again we see the financial press snatching defeat from the jaws of victory in understating the positive and overstating the negative. The message of the financial market, which is the single most reliable indicator of future business conditions we have at our disposal, has been positive since last March. It accurately predicted the economic rebound from early 2009 onward and still hasn’t shown us that it’s time to be unduly worried about consumer deleveraging or the possibility of a “double dip” recession.
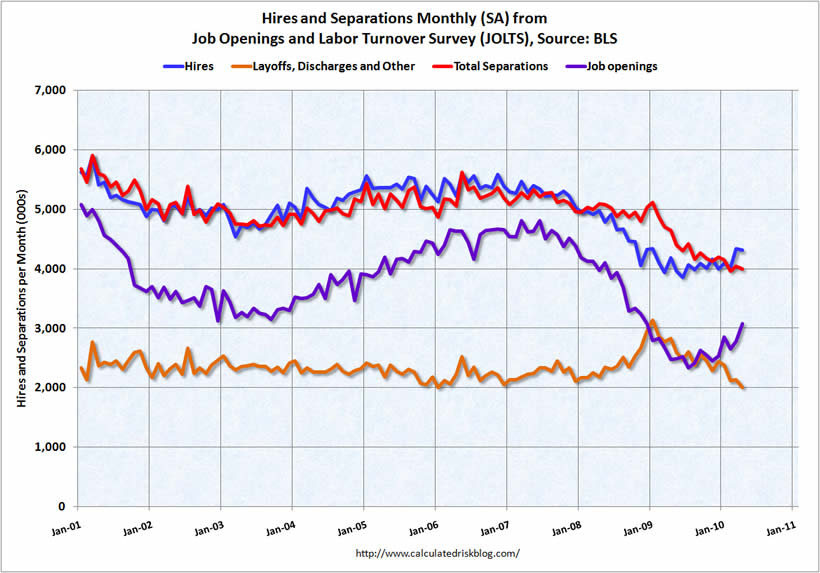
FYI, the web site www.calculatedriskblog.com published a meaningful graph recently which shows the recovery trend in the labor market. It’s worth showing again here.
Gold price
The gold price had a nice little rally going on last week and our proxy for gold, the SPDR Gold Trust ETF (GLD, 122.83), was up over 2% in the last couple of day and closed the latest week at a new high. We’ve been on a buy signal for GLD since the moving average confirmation signal The price for GLD ended up making a new high and has exceeded the pivotal 122 resistance level. Now that GLD has decisively cleared above 122 we could see additional buying interest in GLD from both the retail crowd as well as the hedge fund cliques. At the same time, we’ll also need to watch for potential short-term exhaustion since the move to new highs is already garnering headlines and is turning to the investor psychological profile for the yellow metal bullish. This will eventually work against the rally as the longs pile in and the smart money takes profits but for now the market’s forward momentum is still a force to be reckoned with.
How to Trade the Most Profitable Chart Pattern
One of the most profitable chart patterns is also one that receives virtually no recognition from market technicians. The pattern I’m referring to is the “channel buster,” which can be either a bullish or a bearish pattern depending on how it manifests in the charts of actively traded stocks and commodities. This highly profitable pattern was aptly named by stock market veteran Don Worden, editor of Worden’s Weekly Reports. As its name implies, the channel buster involves a price breakout (or breakdown) either above or below the outer extremity of a trading channel.
The channel buster can be highly profitable if you know how to spot it. It’s a chart pattern that is commonly seen in bull markets and bear markets alike and is the ultimate “all weather” money maker for short-term oriented traders. In my book, “Channel Buster” How to Trade the Most Profitable Chart Pattern,” I explain the mechanics of this amazing chart pattern and how you can spot it an almost any actively traded stock or commodity. The book also provides rules for entering and exiting a trade based on the channel buster method. This is the only book available that deals exclusively with the channel buster. The channel buster is a breakthrough in the trend analysis of stocks and commodities.
The book was written so that retail traders might be able to understand and practically apply these useful methods of market analysis. The book is now available for sale at: http://www.clifdroke.com/books/channelbuster.mgi
By Clif Droke
www.clifdroke.com
Clif Droke is the editor of the daily Gold & Silver Stock Report. Published daily since 2002, the report provides forecasts and analysis of the leading gold, silver, uranium and energy stocks from a short-term technical standpoint. He is also the author of numerous books, including 'How to Read Chart Patterns for Greater Profits.' For more information visit www.clifdroke.com
Clif Droke Archive |
© 2005-2022 http://www.MarketOracle.co.uk - The Market Oracle is a FREE Daily Financial Markets Analysis & Forecasting online publication.