U.S. Bank Credit Increases a Healthy 8.3%, But One Month Does Not Make a Trend
Economics / US Economy Aug 18, 2010 - 05:26 AM GMTBy: Paul_L_Kasriel
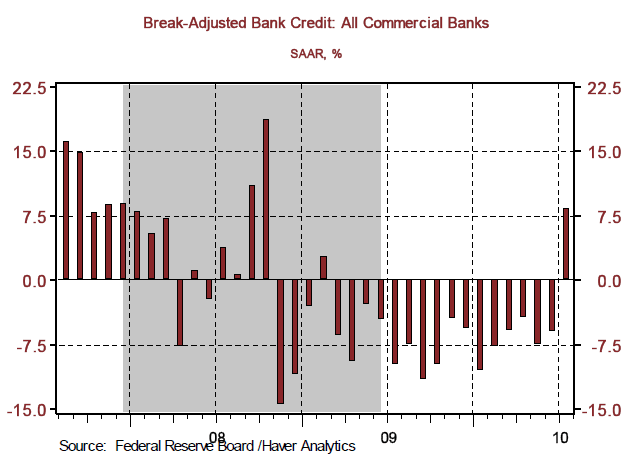
 In July, for only the second time in the past 21 months, U.S. commercial bank total credit (loans and securities) increased (see Chart 1). And it was a healthy increase at 8.3% annualized. Obviously, we do not know whether this is the beginning of an upward trend in bank credit. But if it is, then we feel a lot more confident about our 2011 real GDP forecast, which has the economy's growth rate picking up. The primary assumption underlying our forecast of faster real GDP growth in 2011 is a resumption in the growth of bank credit.
Chart 1
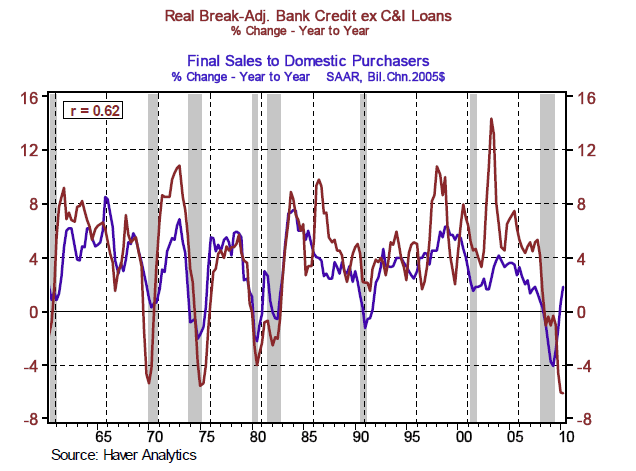
Why do we place such an emphasis on bank credit as a causal factor with regard to the aggregate demand for goods and services? Because we believe that increases in bank credit unambiguously allow those entities borrowing from the banking system to increase their purchases of goods, services and assets without requiring any other entity to simultaneously reduce its current purchases. In the nomenclature of the Austrian economic school, the banking system creates purchasing power for its borrowers, whereas nonbank grantors of credit merely transfer their purchasing power to their borrowers. Growth in price-adjusted bank credit, excluding commercial & industrial (C&I) loans, has a relatively high correlation (0.62) with growth in real domestic demand for final goods and services, as shown in Chart 2. The reason we exclude C&I loans is that their behavior tends to lag the business cycle. The reason C&I loans tend to lag the business cycle is that a large part of C&I loans are used to finance business inventories, especially near business expansion peaks, when inventories are accumulating faster than business sales are increasing.
Chart 2
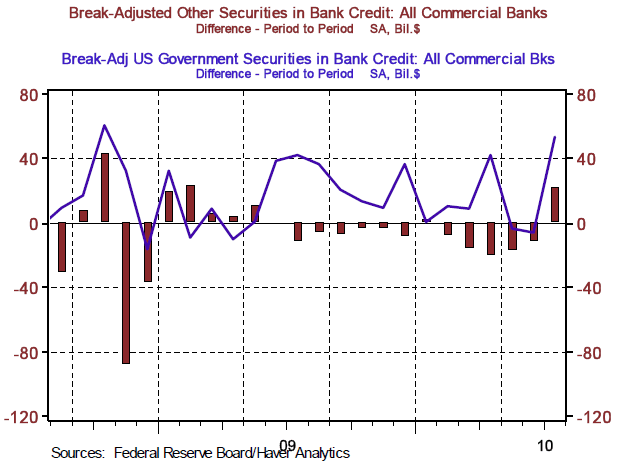
The increase in July bank credit was dominated by an increase in securities acquisitions rather than an increase in loans, noting that the rate of contraction in bank-issued loans and leases slowed (see Chart 3). Although the July increase in the banking system's acquisition of securities was concentrated in Treasury and agency securities, the July increase in "other" securities was the largest since February 2009 (see Chart 4). The significance of an increase in the acquisition of these "other" securities by commercial banks is that the addition of these assets incurs a charge to risk-based capital of commercial banks. Despite being more-than-adequately capitalized in the aggregate, banks have been hoarding their capital in the past year rather than committing it to new loans and securities. The fact that the banking system was willing to commit some risk-based capital in July is an encouraging sign that banks may finally be confident enough about their future capital positions to start currently increasing their earning assets.
Chart 3
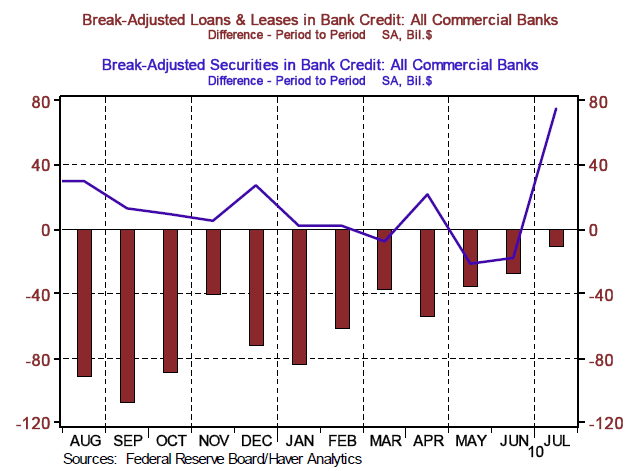
Chart 4
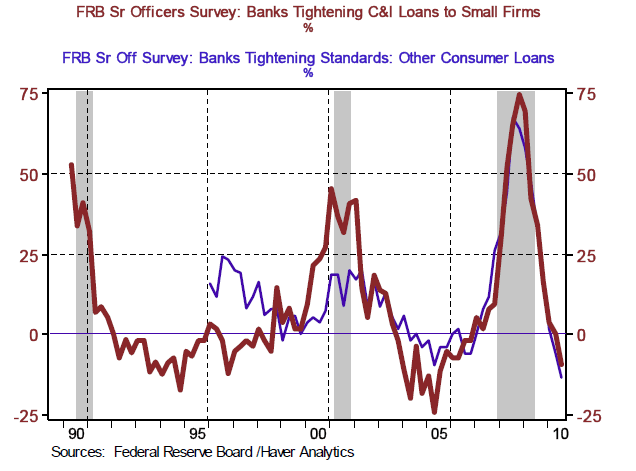
There is some other evidence that would suggest that the July increase in bank credit was more than just a one-off event. The recently-released Federal Reserve Senior Loan Officer Lending Practices Survey indicated some actual easing in commercial bank lending terms to small businesses in July and easing in lending terms to consumers for the second survey in a row (see Chart 5). If lending terms continue to ease, this will be a very positive sign for bank credit growth going forward and for aggregate demand growth in 2011.
Chart 5
However, given the lags between growth in real bank credit and growth in real aggregate demand, the prior quarters of contraction in real bank credit imply very weak growth in real aggregate demand over the remainder of this year. In our July update, we made significant downward revisions to our real GDP growth forecast for the second half of this year. In this August update, we have revised down our Q3:2010 real GDP annualized-growth forecast from 1.8% to 1.4%. The principal factor driving this downward revision is weaker-than-previously projected real consumer spending. The soft July retail sales data are what motivated this downward revision.
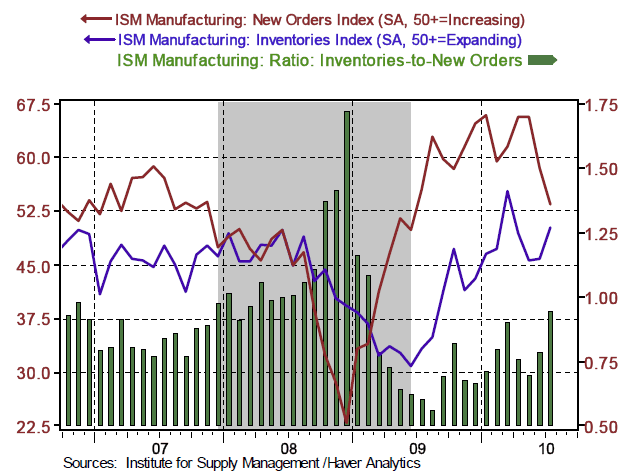
The July ISM Manufacturing report suggests that inventory rebuilding will be providing less lift to production going forward. This is illustrated in Chart 6. The July ISM Manufacturing New Orders index dropped by 5 points as the Inventories index increased by 4.8 points. This pushed the ratio of the Inventories-to-New Orders indexes up to a level of 0.938 - the highest ratio level since February 2009 and higher than it was in November 20007, the month before the peak in the last business expansion. The behavior of these data is consistent with the notion that some involuntary inventory accumulation is beginning to occur, which, in turn, would imply some slowing in new ordering of inventories.
Chart 6
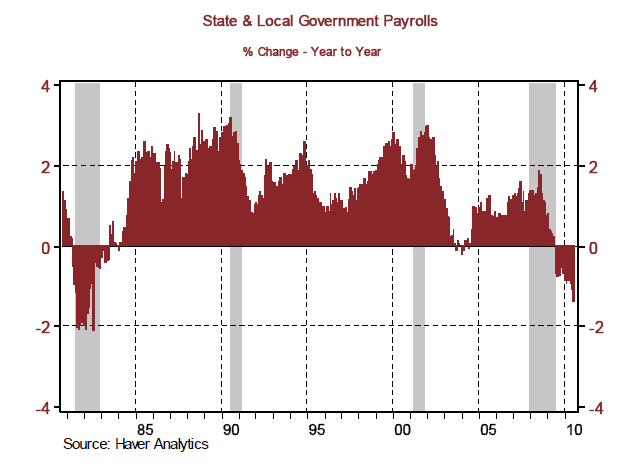
Last month we noted that state & local government employment accounted for nearly 15% of total nonfarm payrolls. The ranks of this relatively important sector of employment are growing smaller as state & local governments are being forced to layoff staff due to budgetary challenges. In July, state & local government payrolls were trimmed by 48,000 (see Chart 7), part of the 212,000 cumulative decline in these payrolls in the 12 months ended July. On a year-over-year percentage basis, state & local government payrolls declined 1.37% in July, the largest percentage decline since the 1981-1982 recession (see Chart 8). Given the budgetary challenges that lie ahead for state & local governments, especially with regard to the underfunding of their pension plans, it is likely that the year-over-year percentage declines in state & local government payrolls in the months ahead will match those registered during the 1981-1982 recession. It also is likely that these laid off state & local government workers will have difficulty being absorbed by private employers. Thus, U.S. production of services will be adversely affected by these layoffs.
Chart 7
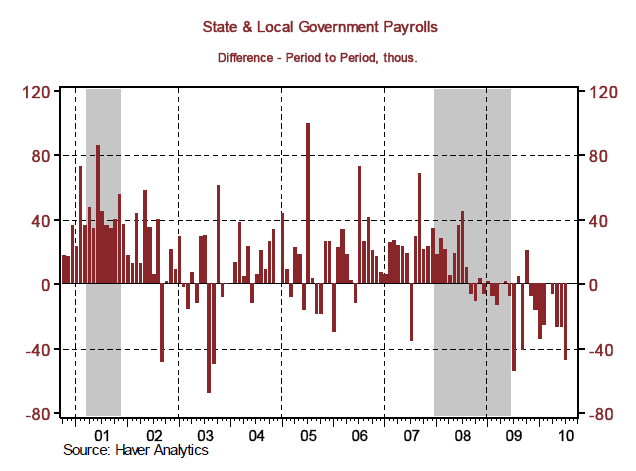
Chart 8
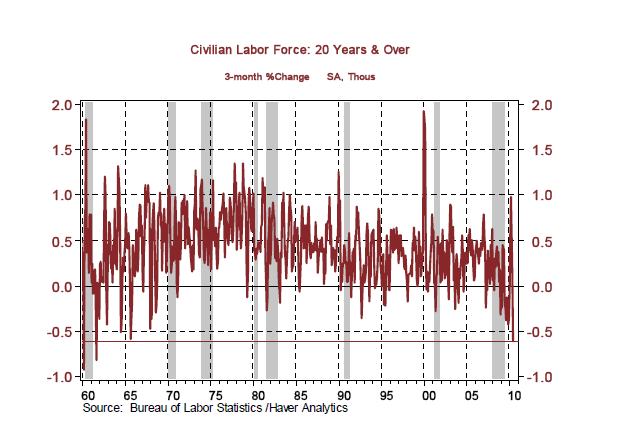
Speaking of unemployment, the monthly state unemployment insurance claims data suggest that the condition of the labor market is, at the very least, improving at a slower pace. Chart 9 shows that the year-over-year percent change in initial unemployment claims has begun to decline at a slower pace. Had it not been for the extraordinary 0.61% decline in the 20-year-old and above civilian labor force in the three months ended July (see Chart 10), it is quite likely that the headline unemployment rate would have risen above its 9.5% level. Because we believe that there will be some growth in the labor force in the coming months, because there are indications from the state unemployment insurance data that the labor market's recent improvement is slowing down and because we believe that the growth in real GDP over the second half of this year will be insufficient to generate enough jobs to employ new entrants to the labor force, we are projecting an increase in the headline unemployment rate to a level above 10% in the fourth quarter of this year.
Chart 9
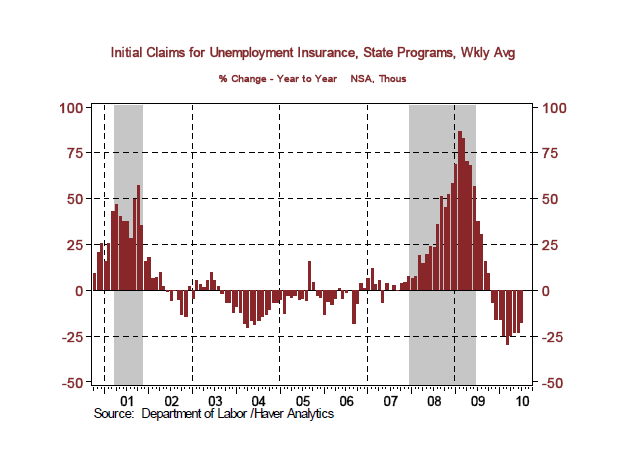
Chart 10
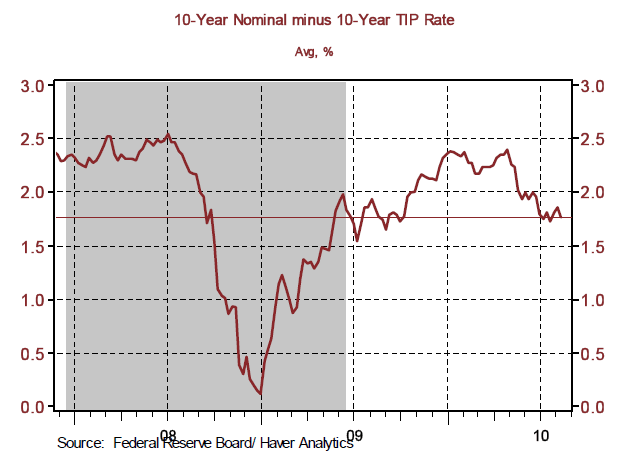
The so-called bond market vigilantes appear to have identified a new desperado - deflation rather than inflation. (As an aside, we never bought into the original interpretation of bond market vigilantes. The original interpretation was that a rise in longer-term Treasury yields would, in and of itself, brake the growth in nominal aggregate demand and prevent inflation. In contrast, it has been our view that a rise in longer-term Treasury yields relative to the level of the federal funds rate was an indication of an increase in the economy's overall demand for credit, more of which was being accommodated by the banking system, including the central bank.) In the past six months ended July, the All-Items CPI has increased at an annualized rate of just 0.01% and in the past 12 months ended July the Trimmed-Mean CPI, calculated by the Federal Reserve Bank of Cleveland, has increased at an annual rate of just 0.86% (see Chart 11). With the market-implied rolling 10-year average CPI inflation rate trending up from a mere 0.12% at the end of 2008 to just under 2.40% by January 2010, the market-implied CPI inflation rate has backed down to 1.76% as of mid August (see Chart 12).
Chart 11
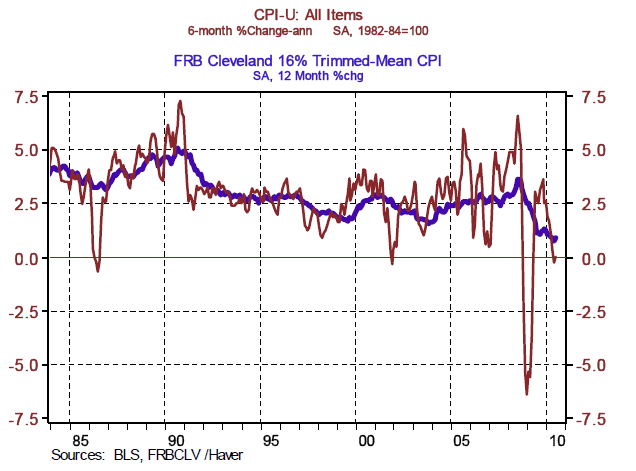
Chart 12
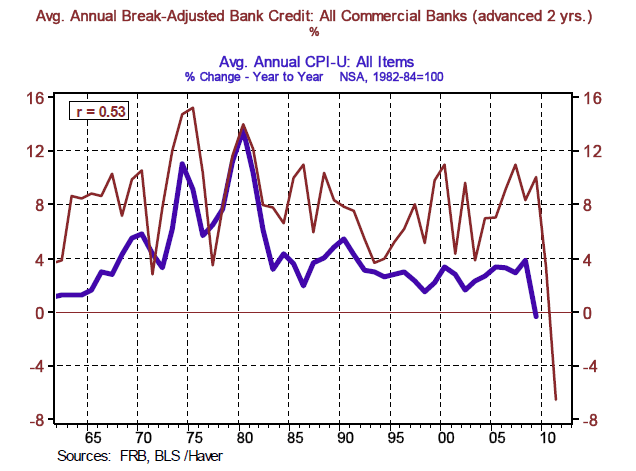
Is there any basis for believing the message being sent by the Treasury bond market that the risks are tilted toward deflation rather than an outbreak of significantly higher inflation? Yes. We return to our old "friend," bank credit. On an annual average basis, there is a relatively high correlation (0.53) between growth in average annual bank credit in a given year and annual average CPI inflation two years later (see Chart 13).
Chart 13
How does the Federal Reserve respond to all this? At the August 10 meeting, the FOMC decided to back off its implicit quantitative tightening policy and go with a quantitative neutral policy. That is, rather than allowing its holdings of securities gradually run down as its holdings of agency mortgage-backed securities matured, the FOMC decided to re-invest the proceeds of maturing mortgage-backed securities in Treasury coupon securities up to 10 years in maturity. If bank credit continues to grow, we would expect that there would be no moves by the FOMC toward increasing the level of its holdings of securities. We do not expect any sort of policy interest rate increases - federal funds rate or interest rate paid on excess reserves - by the Fed over the remainder of this year. If bank credit continues to grow on a sustained basis and aggregate demand growth starts to pick up in the first half of 2011, which is our current forecast, then the Fed would be expected to begin raising policy interest rates around mid-year 2011. But we caution you, there are many data points between now and then.
THE NORTHERN TRUST COMPANY ECONOMIC RESEARCH DEPARTMENT
August 2010 SELECTED BUSINESS INDICATORS
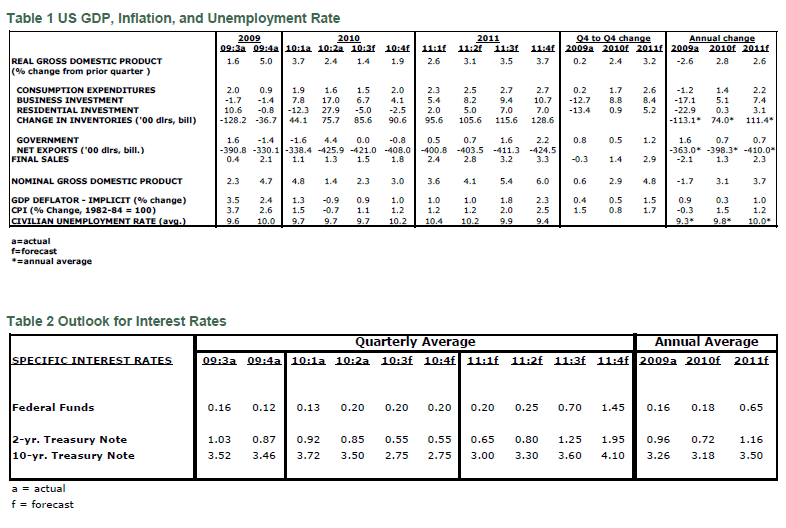
by Paul Kasriel & Asha Bangalore
Paul Kasriel is the recipient of the 2006 Lawrence R. Klein Award for Blue Chip Forecasting Accuracy
by Paul Kasriel
The Northern Trust Company
Economic Research Department - Daily Global Commentary
Copyright © 2010 Paul Kasriel
Paul joined the economic research unit of The Northern Trust Company in 1986 as Vice President and Economist, being named Senior Vice President and Director of Economic Research in 2000. His economic and interest rate forecasts are used both internally and by clients. The accuracy of the Economic Research Department's forecasts has consistently been highly-ranked in the Blue Chip survey of about 50 forecasters over the years. To that point, Paul received the prestigious 2006 Lawrence R. Klein Award for having the most accurate economic forecast among the Blue Chip survey participants for the years 2002 through 2005.
The opinions expressed herein are those of the author and do not necessarily represent the views of The Northern Trust Company. The Northern Trust Company does not warrant the accuracy or completeness of information contained herein, such information is subject to change and is not intended to influence your investment decisions.
Paul L. Kasriel Archive |
© 2005-2022 http://www.MarketOracle.co.uk - The Market Oracle is a FREE Daily Financial Markets Analysis & Forecasting online publication.


