


Gold and Silver Analysis - Precious Points: Is This the Big One?
Commodities / Gold & Silver Sep 23, 2007 - 02:03 AM GMTBy: Joe_Nicholson
 “A new attempt at $725 is entirely likely given the expectations for next week, but losing the psychologically important 7-handle is also a realistic possibility. A move of the 5-week moving average above $700 for the first time in this entire bull market would be a more convincing indication of the sustainability of the current move. The next move in silver could be in either direction, but … recent action has been encouraging. There's no lack of reasons to be cautious at these lofty levels… far from a call to sell gold and silver, it is a call for caution”. ~Precious Points: Old Number 7 , September 15, 2007
Remember this chart?
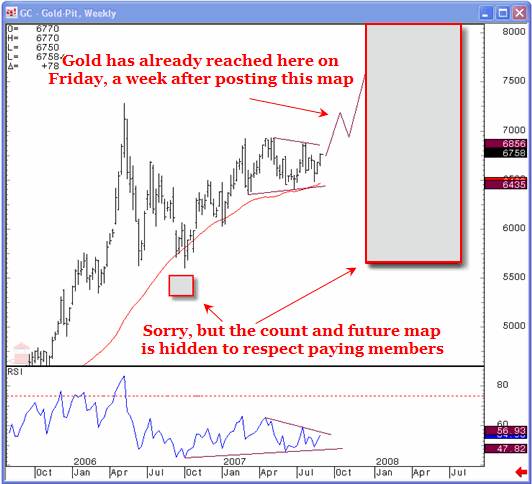
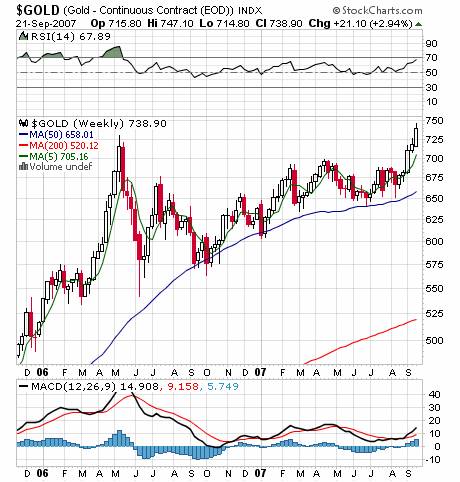
On September 9th , this update told you that a Fed rate cut could be the catalyst that propels gold to the target in the chart above, clearly at least more than $750. As I'm sure you know, the Fed's surprising 50 basis point rate cut sent gold on a moonshot through $725 and above the May 2006 highs. And that for the first time in recent memory the 5-week moving average in gold futures is above $700 is a testament to the tenacity of this commodity and the potential longevity of this move! What's more, the target of the chart above and the RSI in the chart below show there can easily still be a higher high before this move is done.
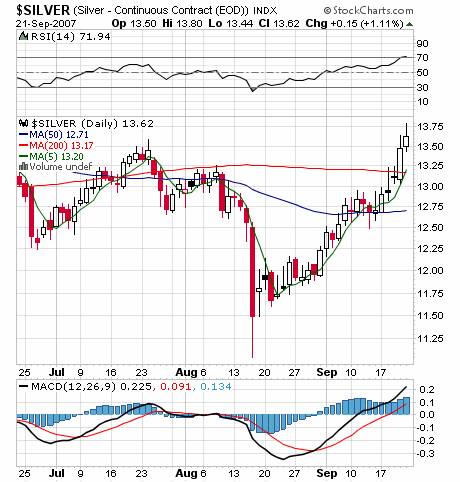
The chart below shows that silver also had an excellent breakout week, finally taking back $13 as expected, recognizing resistance at the 200-day moving average and support at the equilibrium point where the 5-, 50-, and 200-day average had converged back in June.
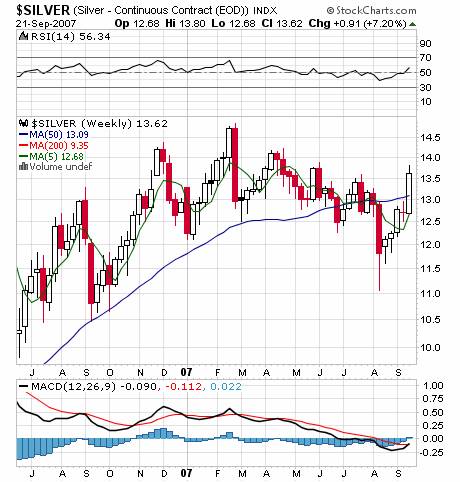
A look at a longer term chart shows silver rocketed up this week from support at the 5-week moving average back up to resistance around the late-May/early-June resistance just under $14. Though again looking short term over bought, the weekly RSI shows silver could also easily see an extension of this move, probably as high as $14.20. Though new highs in the short term appear unlikely from here, this illiquid and highly volatile commodity is subject to dramatic moves and that could make new highs inevitable if investor sentiment and underlying economic conditions continue to drive money toward inflation safe havens.
If the sentiment in recent editions of this update has seemed sour, it should be noted that this tone of caution has not been sounded to keep scalpers or swing traders from profiting on the targets and expectation expressed herein or on the TTC forums. Certainly there's no lack of optimism in the metals markets and amongst the analyst commentators. Instead, the intent has simply been to offer a prudent reminder that all blowoffs end ugly for everyone except those who are forearmed with the knowledge they are taking short term positions and choose their trade vehicles appropriately.
Though the Fed went against every public indication they'd made with their larger-than-expected rate cut, the threats expressed last weekend to this run in gold persist. The two major camps in response to the rate cut seem to be that either the Fed knows the future will be very bad and is trying to preempt a recession, or that the Fed just churned up the makings of the next bubble and will be crucified on a cross of inflation. Given the certainty of increased housing defaults, the ongoing uncertainty of toxic asset ownership, the (un)health of the American consumer as assessed based on outstanding credit instead of retail sales, and now the pessimism of the Fed, caution requires we not ignore the former even if scalping the latter. In other words, the time to load up on physical metal is probably closer to the 50-week moving average than multi-month highs.
Finally, I'd like to just add that Tennessee is a gorgeous State filled with the friendliest people and plenty of exhilarating outdoor activities. And though I didn't make it to the distillery in Lynchburg this time around, I did celebrate this week's gains with some of the good stuff and hope you've been able to do the same. Cheers!
by Joe Nicholson (oroborean)
This update is provided as general information and is not an investment recommendation. TTC accepts no liability whatsoever for any losses resulting from action taken based on the contents of its charts,, commentaries, or price data. Securities and commodities markets involve inherent risk and not all positions are suitable for each individual. Check with your licensed financial advisor or broker prior to taking any action.
Joe Nicholson Archive |
© 2005-2022 http://www.MarketOracle.co.uk - The Market Oracle is a FREE Daily Financial Markets Analysis & Forecasting online publication.