


Rumours of the Death of the U.S. Economy are Premature, Sovereign Debt Exchange For Equity
Economics / US Debt Aug 29, 2010 - 05:45 AM GMTBy: Brian_Bloom

 Conventional wisdom states that levels of Public Debt – in particular in the USA – are too high and there are only three possible outcomes:
- Helicopter Ben’s so-called Quantitative Easing leading to hyperinflation in the USA
- Debt default leading to Depression
- A sideways moving economy for 10-15 years accompanied by churning markets as income is used to repay debt. (A side-effect of this approach will be that tax rates will likely rise significantly even as standards of living decline).
The purpose of this article is to draw reader’s attention to a fourth possibility. Sovereign debt can be exchanged for equity – which is essentially how the Latin American crisis was resolved (?) in the 1980s.
The weekly chart below of the S&P 500 Industrial Index (courtesy DecisionPoint.com) shows that the Industrial markets in the USA are on the brink of another leg down.
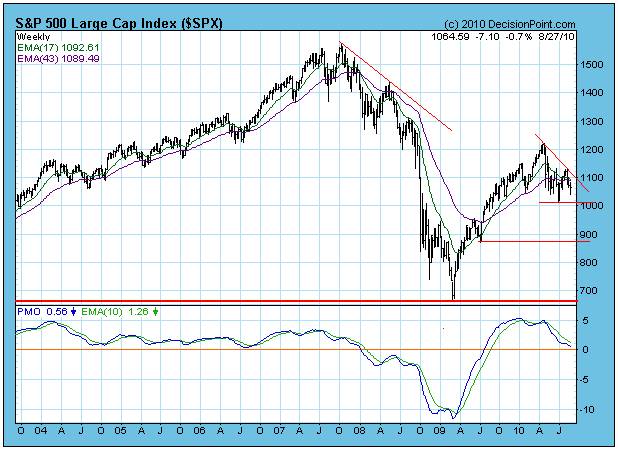
The reader’s attention is drawn, specifically, to the position of the 17 week Moving Average (green line) relative to the 43 week Moving Average (purple line). Whilst the green line is still tracking above the purple line, the last time it crossed over was in December 2008 and this presaged the (first) Financial Crisis. Should it happen a second time what will follow from an economic perspective will likely be both severe and painful.
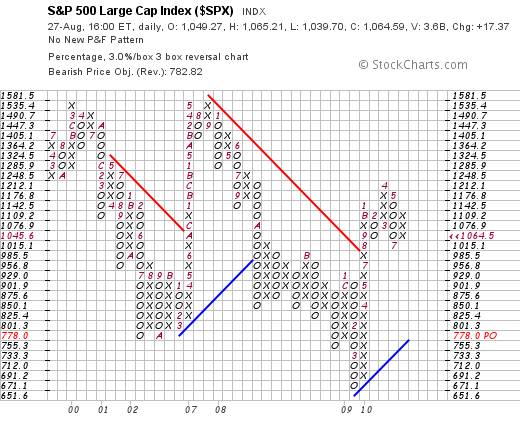
If we look at the same index (The $SPX) on a 3% X 3 Box reversal Point & Figure chart (courtesy stockcharts.com), we see that a break below 1015 is likely to be very serious, with a measured move target of 778 – a potential fall of 26% from current levels.
This analyst has been consistent in his assessment – for reasons that he has repeated so often as to have become boring – that the probability of Primary Bear Market continuing for 10-15 years is high.
The question is: What will be the response of the authorities? Will they man the printing presses? Will they stand back and allow the markets to crumble? Will they do what they can to maintain the status quo?
From a financial perspective, the core issue is “sovereign debt” – as can be seen from the chart below: (source: http://www.businessinsider.com/pimcos-ring-of-fire-chart-shows-the-true-state-of-sovereign-debt-2010-1 )
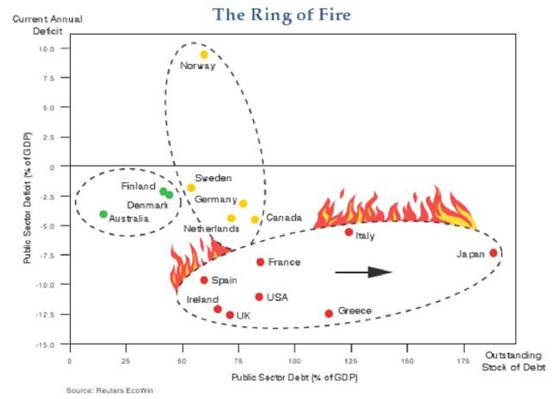
US Debt as a percentage of US GDP is now in excess of 75% and trending towards 100%.
What many people appear to forget is that international trade is a zero sum game. When one country has a negative trade balance and is running down forex reserves, another one has a positive trade balance and its forex reserves are rising. Profits become reserves, which are assets.
All balance sheets require double sided entries. Assets are funded by liabilities and accumulated shareholder funds. Profitable countries like China have, effectively, high levels of shareholder funds relative to debt whilst unprofitable countries like those above in the ring of fire have high levels of debt relative to shareholder funds.
It follows that if liabilities rise to too high a level, perhaps its time for the debtor countries to raise the proportion of equity on their balance sheets. They can do this by selling off assets and using the proceeds to pay down their debts – or by increasing their shareholder equity.
Essentially, that is what “privatisation” has been all about.
But privatisation was really a sleight of hand. The argument wasn’t focused on debt:equity swaps, it was focused on operational efficiency. The argument was that public assets in private hands could be managed more efficiently. (And oh, incidentally, we will raise a bunch of cash).
Well, let’s focus on the debt:equity swap issue specifically. It is conceivably possible that, if the US (as an example) can raise sufficient capital to pay down its debts by selling off assets then, provided it can balance its budget thereafter, it can start to think about rebuilding its economic infrastructure.
Against this background of rising debts and potentially falling equity markets, the US Dollar is showing surprising strength – as can be seen from the chart below (Courtesy decisionpoint.com)
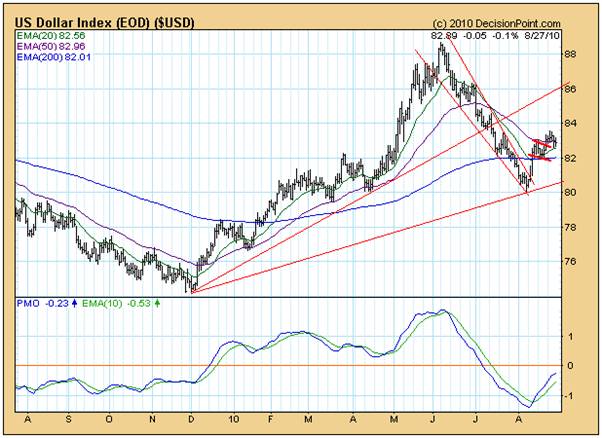
Note how the 20 day Moving Average bounced up from the 200 day MA and how it seems to be wanting to cross over the 50 day MA which is tracking above the 200 day MA.
When we look at the Point & Figure Chart (courtesy stockcharts.com) it seems to be anticipating a measured move target of 114.
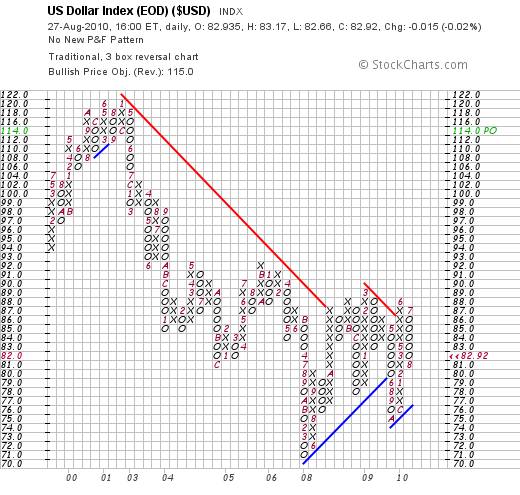
So this begs the question: If the Stock Market is looking so vulnerable, why is the US Dollar looking strong?
One facile reason might be that the bond market is looking unusually strong – as can be seen from the following chart – and on the face of it, perhaps it’s too strong.
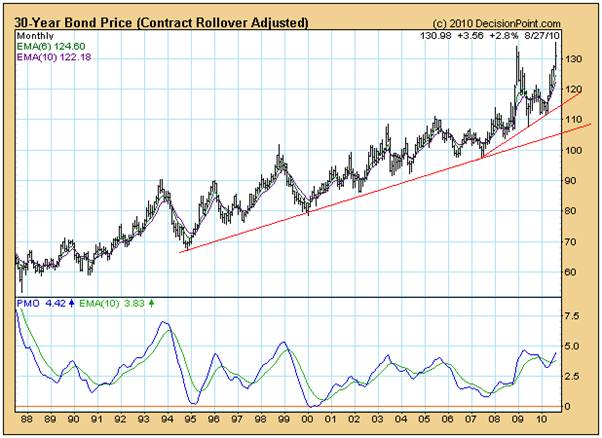
Why is there such a demand for bonds?
The conventional argument is “flight to safety”.
But how can the bond market be regarded as a “safe haven” given the historically high levels of Public Debt. As of last night, for example, US Public Debt was $13.38 trillion (source: http://www.treasurydirect.gov/NP/BPDLogin?application=np ):

With such a high level of debt, surely the US Government represents a credit risk?
Well now, let’s refocus our attention on something that is seemingly outside the box. “Democracy” is defined as “Government of the people by the people for the people”. There is no real differentiation between the government and the public. The government is appointed to represent the public. What the government owns, belongs to the public. What the government owes is owed by the public – hence the term “public” debt.
As an aside, in a communist environment, by contrast, what the public owns belongs to the government. Communism is a function of a different mindset. Socialism is a neither here nor there concept. Think of a dart board. If the first dart lands on double one and the second dart lands on double 20 you are not, on average, hitting the bull’s eye. Socialism kind of argues that you are.
OK, so in a truly democratic environment where the government has amassed huge debts what has really happened is that it has amassed those debts as representatives of the public. The question is: Does the public have the assets to cover the total obligations of the public plus the government?
The chart below (source: http://www.wordyard.com/2010/07/19/party-context-of-that-staggering-debt-chart/ ) shows total US (public and private debt) at 357% of GDP
By implication, if US GDP is around $14 trillion this implies total debt of around $50 trillion.
Well, that’s the liabilities side. What does the asset side of the balance sheet look like?
Back of the envelop calculations, ignoring foreign ownership:
A. Domestic Real Estate
Number of housing units in 2009: 129,925,421 (source: http://quickfacts.census.gov/qfd/states/00000.html )
Median Value of owner-occupied housing units in 2000: $119,600 (source: ibid)
Total value of all housing units in USA, assuming all are at median 2000 value:
$15.5 trillion
B. Equity Markets
Quote:
“year-to-date return [of the Wilshire 5000 Index] to -5.83 percent and resulted in an estimated decrease in market value of $1.6 trillion”
Source: http://www.wilshire.com/Company/June_2010_Wilshire_Indexes_News_Release.pdf
Bloom calculation: $1.6 trillion / .0583 = implied value of US Equities at June 30th 2010 of:
$27.4 Trillion
C. Capital Markets
It might surprise some readers to discover that of the $12.8 trillion public debt outstanding as at March 2010, only 3.9 trillion was held by foreigners. Therefore, approximately $8.9 trillion represented “assets” in the hands of local investors.
Source: www.fms.treas.gov/bulletin/b2010_2ofs.doc
In Q1 of 2010, the total size of the US Bond Market (assets in the hands of investors) was:
$35.2 Trillion
Source: http://www.sifma.org/research/research.aspx?ID=10806
Analyst observation:
Readers are starting to get the point. Although the total outstanding US debts are around $50 trillion, these are backed by assets well in excess of $75 trillion, ignoring foreign ownership, which is only a small proportion of the total.
Importantly, these are “tangible” assets. One cannot just ignore the value of Intellectual Property and neither can ignore the value of state and/or corporate owned real estate. In particular, Intellectual Property is where the true value of the US entrepreneurial culture lies.
D. The Value of Entrepreneurialism and Intellectual Property
Let’s now focus on this particular issue. Time Magazine recently ran an article entitled How the Stimulus Is Changing America which can be found at http://www.time.com/time/nation/article/0,8599,2013683-1,00.html
The following is a relevant quote:
“For starters, the Recovery Act is the most ambitious energy legislation in history, converting the Energy Department into the world's largest venture-capital fund. It's pouring $90 billion into clean energy, including unprecedented investments in a smart grid; energy efficiency; electric cars; renewable power from the sun, wind and earth; cleaner coal; advanced biofuels; and factories to manufacture green stuff in the U.S. The act will also triple the number of smart electric meters in our homes, quadruple the number of hybrids in the federal auto fleet and finance far-out energy research through a new government incubator modeled after the Pentagon agency that fathered the Internet.
Read more: http://www.time.com/time/nation/article/0,8599,2013683-1,00.html#ixzz0xx7aCmd9
Conclusion
Through a process of financial engineering involving (possibly) Sovereign Debt:Equity swaps, the proportions of debt and equity on the US Sovereign Balance Sheet can be rebalanced. The country has more than sufficient assets and it will be a function of financial creativity.
Thereafter, with a waning interest burden on the national economy, the energy related “drivers” of the new economy which are now being put in place (see the Time Magazine article) can be relied upon to create employment opportunities. Yes, the world economy will still need to go through a period of painful readjustment. Yes, we will need to re-introduce at corporate and Government Board Level the concepts of integrity and value-for-money in respect of services rendered. Yes, it will take several years for the reorganization process to be completed. But, as Mark Twain once put it “Rumours of my death are premature”. Talk of “Hyperinflation” and “financial chaos” should be taken with a pinch of salt. The end is by no means nigh, even if the Primary Trend of the equity markets remains bearish for 10-15 years.
By Brian Bloom
Once in a while a book comes along that ‘nails’ the issues of our times. Brian Bloom has demonstrated an uncanny ability to predict world events, sometimes even before they are on the media radar. First he predicted the world financial crisis and its timing, then the increasing controversies regarding the causes of climate change. Next will be a dawning understanding that humanity must embrace radically new thought paradigms with regard to energy, or face extinction.
Via the medium of its lighthearted and entertaining storyline, Beyond Neanderthal highlights the common links between Christianity, Judaism, Islam, Hinduism and Taoism and draws attention to an alternative energy source known to the Ancients. How was this common knowledge lost? Have ego and testosterone befuddled our thought processes? The Muslim population is now approaching 1.6 billion across the planet. The clash of civilizations between Judeo-Christians and Muslims is heightening. Is there a peaceful way to diffuse this situation or will ego and testosterone get in the way of that too? Beyond Neanderthal makes the case for a possible way forward on both the energy and the clash of civilizations fronts.
Copies of Beyond Neanderthal may be ordered via www.beyondneanderthal.com or from Amazon
Copyright © 2010 Brian Bloom - All Rights Reserved
Disclaimer: The above is a matter of opinion provided for general information purposes only and is not intended as investment advice. Information and analysis above are derived from sources and utilising methods believed to be reliable, but we cannot accept responsibility for any losses you may incur as a result of this analysis. Individuals should consult with their personal financial advisors.
Brian Bloom Archive |
© 2005-2022 http://www.MarketOracle.co.uk - The Market Oracle is a FREE Daily Financial Markets Analysis & Forecasting online publication.