


Stock Market Indices Close with Solid Surge
Stock-Markets / Stock Markets 2010 Sep 03, 2010 - 05:05 AM GMTBy: Harry_Boxer

 The stock market indices had a strong start, consolidated mid-day, and ended the day with a very solid surge to close at the session highs going away and right at key overhead resistance near 1090 on the S&P 500 and 1840 on the Nasdaq 100.
Progress was made today as the indices advanced 50.63 on the Dow at 10,320.10. The S&P 500 was up 9.81 at 1090.10. Nasdaq 100 up 20.53 at 1840.58.
Advance-declines were a little better than 2 1/2 to 1 positive on the New York Stock Exchange and a little better than 3 to 2 positive on Nasdaq. Up/down volume, however, was the story, with a 5 to 1 positive ratio on New York on volume of a light 950 million shares. Nasdaq traded a little less than 1 2/3 billion, but had a 7 to 1 positive rally of advancing volume over declining volume.
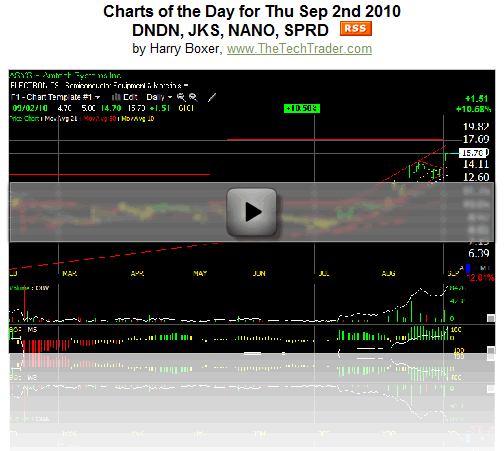
Charts of the Day:
Dendreon Corp. (DNDN), which had come down hard from the April high when it spiked up to 57 on drug approval news, then came down into the mid-20s. The stock bounced, pulled back, did a retest, then did a 5-wave move up towards key resistance around 40-40 1/2. At that point it went through a 3-4 week consolidation, popped yesterday, today broke through and closed at 40.57 up 2.33, or 6% gain on 6.6 million. That's the heaviest volume in a month. It certainly looks like this stock has broken out of this basing pattern. Next is a test of 44 resistance, and beyond that perhaps back up towards the 48-50 zone.
JinkoSolar Holding Co., Ltd. (JKS) is a stellar chart and excellent performer. The strong rising channel after the breakout in July near the 11 range has continued. This stock has moved about 140%-150% to near 27 today, reaching 27.60 at one point, which was a breakout of the wedge. Although it did back off, it closed up 1.58, or 6%, on more than 1 million shares. That's the heaviest volume since we've been following it. Looks like the top of the channel that's currently in place, although it's a sharply rising one, may get a press, and that's around 33 1/2 - 34.
Nanometrics Incorporated (NANO) continues to act well. After the long consolidation following the big rise of last year, the stock gapped up in Aug, flagged, broke out again, wedged, and here it appears to be coming out of the wedge as volume picks up. This stock looks like it's headed to 17, my short-term trading target.
Spreadtrum Communications Inc. (SPRD) is a member of our top 25, and you can see why. Great looking technicals. Nice platform here. Consolidation. It broke out two days ago, followed through today, up another 1.07, or 9.5%, on solid volume with technicals at the high for the year on Money Stream and OBV. Balance of Power is full green. This looks like a stock that could be a runner. Short-term trading target at 14, then 17.
Reviewing our Watchboard:
TheTechTrader.com board was mostly higher with many point-plus gainers. Leading the way today, Amazon.com Inc. (AMZN) was up 2.72 at 135.21, Dendreon Corp. (DNDN) 2.34 at 40.58, Spreadtrum Communications Inc. (SPRD) 1.07 to 12.41, and Valassis Communications Inc. (VCI) 1.37 at 32.78. Acme Packet, Inc. (APKT) advanced 1.30 to 35.33, a new all-time high, and Apple Inc. (AAPL) gained 1.84 to 252.17.
On the downside, the Direxion Daily Small Cap Bear 3X Shares (TZA) was down 1.23 to 32.88, the Direxion Daily Large Cap Bear 3X Shares (BGZ) down 46 cents to 14.51, the iPath S&P 500 VIX Short-Term Futures ETN (VXX) 58 cents to 20.05, and the Direxion Daily Financial Bear 3X Shares (FAZ) 40 cents to 14.50.
Stepping back and reviewing the hourly chart patterns, the indices were up in the morning, consolidated mid-day in bull-flags, and then broke out mid-afternoon. They pulled back and formed mini bull flags, and then ran into the close to finish at the high for the day and for the week at key overhead resistance.
We'll see if they can punch through tomorrow.
Good Trading!
Harry
For more of Harry Boxer, sign up for a FREE 15-Day Trial to his Real-Time Technical Trading Diary. Or sign up for a Free 30-Day Trial to his Top Charts of the Week service.
(c) 2010 AdviceTrade, Inc. All rights reserved. Distributed only by written permission of AdviceTrade and The Technical Trader at info@advicetrade.com . In using any portion of Harry Boxer's content, you agree to the terms and conditions governing the use of the service as described in our disclaimer at http://www.thetechtrader.com
Mr. Boxer's commentaries and index analysis represent his own opinions and should not be relied upon for purposes of effecting securities transactions or other investing strategies, nor should they be construed as an offer or solicitation of an offer to sell or buy any security. You should not interpret Mr. Boxer's opinions as constituting investment advice. Trades mentioned on the site are hypothetical, not actual, positions.
Harry Boxer Archive |
© 2005-2022 http://www.MarketOracle.co.uk - The Market Oracle is a FREE Daily Financial Markets Analysis & Forecasting online publication.