


Stocks Bulls Continue to Run...
Stock-Markets / Stocks Bull Market Sep 13, 2010 - 08:33 AM GMTBy: Mark_McMillan

 The bulls continue to press stocks higher with 200-DMAs representing potential break out levels...
Recommendation: Take no action.
Daily Trend Indications:
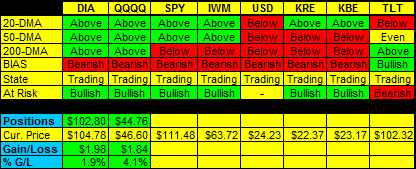
- Positions indicated as Green are Long positions and those indicated as Red are short positions.
- The State of the Market is used to determine how you should trade. A trending market can ignore support and resistance levels and maintain its direction longer than most traders think it will.
- The BIAS is used to determine how aggressive or defensive you should be with a position. If the BIAS is Bullish but the market is in a Trading state, you might enter a short trade to take advantage of a reversal off of resistance. The BIAS tells you to exit that trade on "weaker" signals than you might otherwise trade on as the market is predisposed to move in the direction of BIAS.
- At Risk is generally neutral represented by "-". When it is "Bullish" or "Bearish" it warns of a potential change in the BIAS.
- The Moving Averages are noted as they are important signposts used by the Chartists community in determining the relative health of the markets.
Current ETF positions are:
Long at DIA $102.80
Long QQQQ at $44.76
Daily Trading Action
The major index ETFs opened higher and immediately dove lower at the open and as they moved into negative territory in the first fifteen minutes of trading, just as suddenly reversed and began to move higher. That move resulted in a new intraday high achieved before 11:00am EDT when the markets again reversed with a low put in shortly after noon. For the Dow and S&P-500, this was a higher intraday low, while the NASDAQ-100 broke below the low put in during the initial dive lower from the open. All the major indexes decided to head higher from that point but struggled for the last one and a half hours of trading finishing off the days highs but well above their higher opens. The Dow even managed to close above its 200-Day Moving Average (DMA). The Semiconductor Index (SOX 316.57 -4.51) continues to ply its way toward a bottom. The Russell-2000 (IWM 63.72 +0.20) continues to eek out minor gains as it positions to confront its 200-DMA. The Bank Index (KBE 23.17 +0.01) treaded water and the Regional Bank Index (KRE 22.37 +0.06) also posted an anemic gain. The 20+ Yr Bonds (TLT 102.32 -0.47) continues to come off its highs closing at its 50-DMA. NYSE volume was very light with only 756M shares traded. NASDAQ volume was again light with 1.692B shares traded.
There was a single economic report of interest released:
- Wholesale Inventories (Jul) rose 1.3% versus an expected rise of 0.4%
The report was released a half hour into the session and bolstered the move higher that had begun about fifteen minutes prior to the release.
Nine out of ten economic sectors in the S&P-500 posted gains and were led by Energy (+1.0%). Financials (+0.1%) and Tech (+0.1%) barely posted gains but Utilities (-0.5%) actually declined as traders are discarding these stocks in favor of taking on higher risk for the potential rewards.
Implied volatility for the S&P-500 (VIX 21.99 -0.82) fell about four percent to again close below its 200-DMA. Implied volatility for the NASDAQ-100 (VXN 22.98 -0.31) fell a bit more than one percent moving further below its 200-DMA.
The yield for the 10-year note rose three and one half basis points to close at 2.795. The price of the near term futures contract for a barrel of crude oil rose $2.20 to close at $76.45.
Market internals were mixed with advancers leading decliners 9:5 on the NYSE and by 6:5 on the NASDAQ. Up volume led down volume 2:1 on the NYSE while down volume led up volume 5:4 on the NASDAQ. The index put/call ratio rose 0.21 to close at 1.93. The equity put/call ratio rose 0.10 to close at 0.71.
Commentary:
Friday's trading saw the Dow finally conquer the 200-DMA with the Russell-2000 and S&P-500 set to confront that resistance on Monday. The financials posted very minor gains, including the two bank indexes we regularly report on. The Semiconductors continue to languish, but in my opinion, look ready to rally.
The potential break above the 200-DMAs for all the major indexes and the Russell-2000 could be the catalyst needed for a move into a top. While it is too early to speculate (I will do so anyway) about the potential turning point, I believe that the move higher will take some sort of pause, perhaps to come back to the level of the 200-DMAs in the next few weeks. I am not looking for a double dip recession, but I am looking for a double dip in housing which will continue to contribute to slow economic growth. This means that there will be further trading opportunities as investors fret over potential economic pitfalls versus get greedy to ensure they achieve better returns than afforded by fixed income securities. For now, we will remain long as we await the return of more normal trading volumes in the coming week.
We hope you have enjoyed this edition of the McMillan portfolio. You may send comments to mark@stockbarometer.com.
If you are receiving these alerts on a free trial, you have access to all of our previous articles and recommendations by clicking here. If you do not recall your username and/or password, please email us at customersupport@stockbarometer.com.
By Mark McMillan
Important Disclosure
Futures, Options, Mutual Fund, ETF and Equity trading have large potential rewards, but also large potential risk. You must be aware of the risks and be willing to accept them in order to invest in these markets. Don't trade with money you can't afford to lose. This is neither a solicitation nor an offer to buy/sell Futures, Options, Mutual Funds or Equities. No representation is being made that any account will or is likely to achieve profits or losses similar to those discussed on this Web site. The past performance of any trading system or methodology is not necessarily indicative of future results.
Performance results are hypothetical. Hypothetical or simulated performance results have certain inherent limitations. Unlike an actual performance record, simulated results do not represent actual trading. Also, since the trades have not actually been executed, the results may have under- or over-compensated for the impact, if any, of certain market factors, such as a lack of liquidity. Simulated trading programs in general are also subject to the fact that they are designed with the benefit of hindsight. No representation is being made that any account will or is likely to achieve profits or losses similar to those shown.
Investment Research Group and all individuals affiliated with Investment Research Group assume no responsibilities for your trading and investment results.
Investment Research Group (IRG), as a publisher of a financial newsletter of general and regular circulation, cannot tender individual investment advice. Only a registered broker or investment adviser may advise you individually on the suitability and performance of your portfolio or specific investments.
In making any investment decision, you will rely solely on your own review and examination of the fact and records relating to such investments. Past performance of our recommendations is not an indication of future performance. The publisher shall have no liability of whatever nature in respect of any claims, damages, loss, or expense arising out of or in connection with the reliance by you on the contents of our Web site, any promotion, published material, alert, or update.
For a complete understanding of the risks associated with trading, see our Risk Disclosure.
© 2010 Copyright Mark McMillan - All Rights Reserved
Disclaimer: The above is a matter of opinion provided for general information purposes only and is not intended as investment advice. Information and analysis above are derived from sources and utilising methods believed to be reliable, but we cannot accept responsibility for any losses you may incur as a result of this analysis. Individuals should consult with their personal financial advisors.
© 2005-2022 http://www.MarketOracle.co.uk - The Market Oracle is a FREE Daily Financial Markets Analysis & Forecasting online publication.