


It's Late September...Where's the Bear?
Stock-Markets / Stock Markets 2010 Sep 18, 2010 - 08:52 AM GMTBy: Steven_Vincent

 (originally published for BullBear Trading Room members on 9/12/10, re-published here with updates)
In the last BullBear Weekend Report on I concluded:
...the likelihood of continued upside in defiance of bearish expectations is high. Whether this represents an intermediate term blip or something more significant is as yet unknown, although there are some long term divergences and indications that point towards a long term bullish conclusion.
We did get that continued updside, though as indicated it was limited by overhead resistance and the exhaustion of the first wave up off the low:
...the short term overbought condition could get even more overbought early this week...Most market observers are already calling for a top and this rally has been greeted with skepticism. In this context I would be looking for a sideways abc formation over the first few days of the week. Traders who are out or looking to add to their long positions could buy the a and c wave lows of wave ii ahead of iii of 3 which should rapidly take the market back to 1131 resistance.
The wave count together with certain technical indicators leads to the conclusion that the first wave is now complete or very nearly so and that we should expect a wave ii pullback this week. Bulls should welcome this as a buying opportunity, particularly fortuitous since most of us likley missed the very rapid rally from the recent low. The ensuing decline should be of sufficient depth and strength to shift sentiment back to solidly bearish in very short order, setting up a powerful iii of 1 of 3 of (3) move back above the downtrend and horizontal resistance.
At this time (Friday, 9/17/10), the market has yet to correct, though it does seem that the stage is set. After grinding lightly higher all week SPX today tapped 1131, the former intraday high, and then faded. It gained 16 pts for the week but most of that came in the Monday morning gap higher and there was little follow through thereafter. There are a number of short and intermediate term technical divergences which suggest a correction is still in order before any further significant advance. Sentiment surveys are showing large numbers of bulls once again and the permabears seem ready to short once again. It's still a trader's market and profit taking is due. And once again, as if on cue, the specter of Sovereign Debt has reared its head in the form of concerns about Ireland. And of course it's late September and with October just around the corner many traders will probably prefer to not take any chances and will play it safe by exiting or holding off on any further buying until after a big sell off.
To sum up the findings of this report: the advance in equities that began near SPX 1040 is most likely the start of a significant bull move, but the first leg of that move is likely at or near its end and will correct soon. Long term, there are a number of developments which auger well for the price of risk assets going forward. We are seeing significant signs of the early stages of a shift from safety back to risk as safe havens such as bonds, Yen and, possibly gold, show signs of topping out. After a brief bout of fear and selling (which bears will misconstrue as the Big Kahuna to the downside), intermediate and long term bullish forces will gain the upper hand and the market will trade higher.
--------------------------------------------------------------------------------
SPX Chart Analysis
Let's have a look at the index comparison chart:
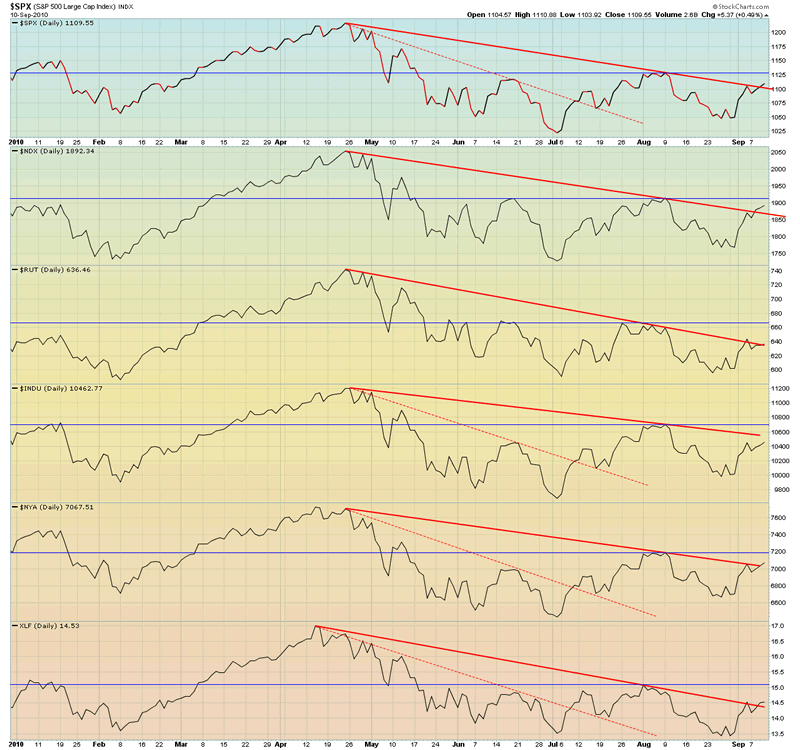
This chart shows that but for the Dow, all of the primary indices are challenging the primary downtrend and most closed the week above resistance. Some have taken out the June high but most have not. It's not uncommon for the first challenge of a major downtrend to fail and together with a wide variety of other technical factors this could stop the advance soon and usher in a substantive pullback.
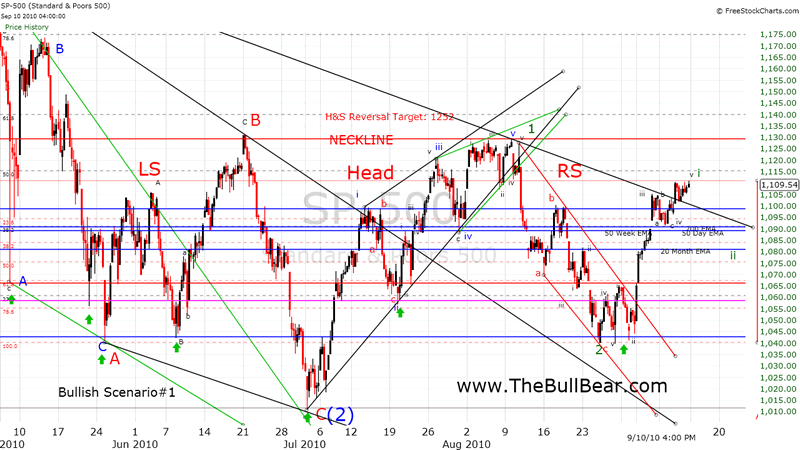
The bullish scenario shows a reverse head and shoulders pattern in the latter stages of development. Although fairly well formed and evident, this pattern has received little if any attention (which increases its chances for completion). Symmetry with the left shoulder may call for a comparable second dip, perhaps even a double bottom. For now we will assume that, as a bullish pattern, the right shoulder will be stronger and the pullback will be more shallow. The 50% Fib retracement level seems reasonable, but rather than specific levels we will be watching for the completion of a clear three wave abc correction to set up a buying opportunity. Indeed, if the above does represent a bottoming pattern, we can see that bulls have been exceedingly patient in their purchases, waiting for a wave of panic selling to step in and buy in size. These patient, strong hands can be seen at the green arrows.
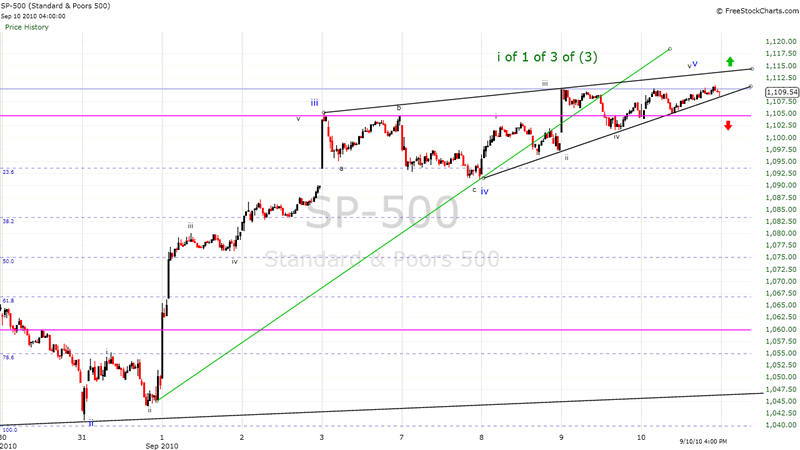
The short term chart of the move off the August 31 low shows a fairly clear 5 wave bullish impulsive move terminating with an ending diagonal wedge pattern. Although an additional push to 1115-1120 is possible on Monday, there are many technical signs which tend to strongly suggest that this first move may be overbought and exhausted. A clear break of the wedge below 1105 would likely initiate a selling wave. Wave counts on the very short term chart can be somewhat diffucult to peg and there is some risk that the count is wrong and there is still upside in this move. But then again, there are many techincal indications which support the view that this wave is complete (coming up later in the report).
Early action in the US futures and Asia has markets jumping on positive economic news out of China, so should these gains hold markets will likely open in the 1115-1120 zone.
Article Continues here.
Generally these reports as well as twice weekly video reports are prepared for BullBear Trading Service members and then released to the general public on a time delayed basis. To get immediate access just become a member. It's easy and currently free of charge.

Disclosure: No current positions.
By Steve Vincent
Steven Vincent has been studying and trading the markets since 1998 and is a member of the Market Technicians Association. He is proprietor of BullBear Trading which provides market analysis, timing and guidance to subscribers. He focuses intermediate to long term swing trading. When he is not charting and analyzing the markets he teaches yoga and meditation in Los Angeles.
© 2010 Copyright Steven Vincent - All Rights Reserved Disclaimer: The above is a matter of opinion provided for general information purposes only and is not intended as investment advice. Information and analysis above are derived from sources and utilising methods believed to be reliable, but we cannot accept responsibility for any losses you may incur as a result of this analysis. Individuals should consult with their personal financial advisors.
© 2005-2022 http://www.MarketOracle.co.uk - The Market Oracle is a FREE Daily Financial Markets Analysis & Forecasting online publication.