


Learn How Out-of-the-Money Butterflies Create Profits Trading SPX Options
InvestorEducation / Options & Warrants Oct 05, 2010 - 02:08 AM GMTBy: J_W_Jones

 Over the past few weeks the broad stock market has seemingly grown increasingly more bullish. Market pundits, traders, and even high profile money managers are stating publicly that the easy trade over the next few years will simply be being long high quality stocks. While time may prove these managers wise, it is likely a bit early to be that bullish.
As a trader, our job is to create profits consistently regardless of price action. The best traders are masters of blocking out the noise and emotion, and letting various forms of data guide their decision making. At this point in time the bulls have the bears pushed against key resistance at the SPX 1150 area. However, the bears have their eyes set on the 1130 level and from there the key SPX 1040 support area.
If the S&P 500 breaks out over the 1150 area with strong volume we could move higher to test recent highs; however, if the 1040 area were to give way to the bears the bullish parade would end. At this point in time, it is too early to tell which side is going to win this battle. The monthly chart of SPX tells the entire story.
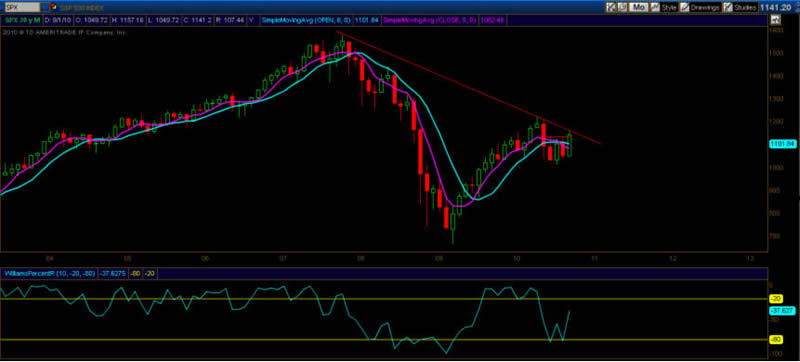
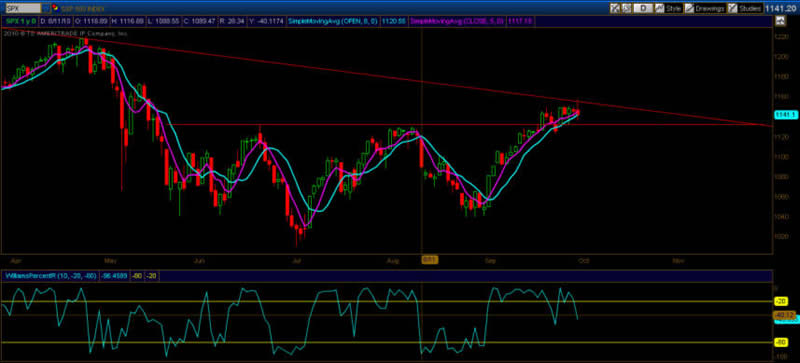
Until proven otherwise, my bias is to the downside. What might surprise most readers is the reasoning behind my thinking. My expectation of lower prices has nothing to do with macro economic conditions, it has nothing to do with unprecedented intervention that we have witnessed by the United States federal government, and it has nothing to do with housing numbers. The reasoning behind potentially lower prices is simple, defined risk. The SPX chart above and even the daily chart listed below are both indicative that the SPX 1150 area is a critical psychological level for market participants. We are literally at a precipice right here, right now.
When major resistance or support is very near the current spot price of any underlying, typically low risk/reward setups can be found. After spinning through several ideas and option strategies, an out of the money butterfly spread seemingly made a lot of sense. The out of the money butterfly spread would benefit from the passage of time and would not be as exposed to a comeuppance in volatility. This strategy could produce a great potential return for a defined amount of risk.
After some brief analysis, the best proxy was using the Spider ETF SPY as opposed to the SPX index. The bid/ask spreads are quite wide on SPX at times, particularly when volatility is rising. Consequently, it can be arduous to get decent fills from the SPX market makers in rapidly moving market conditions which seem to be the norm recently. Besides the normal option expiration on monthly or quarterly basis, options that expire every week have grown in popularity recently. A primary reason why volumes have exploded is due to the weekly expirations routine offering of unbelievable risk/reward setups, particularly through the utilization of Theta (time) decay trading setups.
After running through various expiration dates, it made since to utilize the October weekly options that expire on Friday, October 8. Since I have a bias to the downside, I used an out of the money put butterfly. Traditional butterflies are typically written where the current price is straddled by the wings of the butterfly spread. In an out of the money butterfly, an option trader places the entire position out of the money. It helps reduce the cost of the butterfly, and because the option contracts are out of the money, they are not impacted as harshly by rising volatility. In addition, these out of the money butterflies usually have very attractive risk/reward characteristics.
SPY was trading around $114.13/share at the close on Thursday, so the out of the money butterfly I constructed had the following strikes: Long 1 OCT WKLY. SPY 108 Put / Short 2 OCT WKLY. SPY 111 Puts / Long 1 OCT WKLY. SPY 114 Put. Here is a snapshot of the SPY October weekly option chain as of the close Thursday:
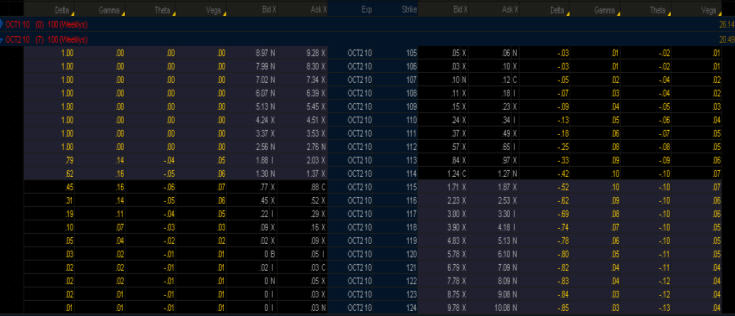
The Thursday closing option prices are as follows for the butterfly mentioned above: SPY 108 Put = $18/contract; SPY 111 Put = $37/contract; SPY 114 Put = $127/contract. The total cost to place the out of the money SPY weekly put butterfly would have been $71 per side (not including commissions). The maximum gain at expiration on this trade would be a close at $111/share on SPY and it would produce a profit around $225 (not including commission).
Clearly we would not expect to achieve the maximum gain, but this trade would produce a profit if SPY closed between $108.70/share and $113.30/share at expiration (October 8). The profitability chart is below; keep in mind that the red line is the valuation at expiration and the white line would be the profit based on that particular day.
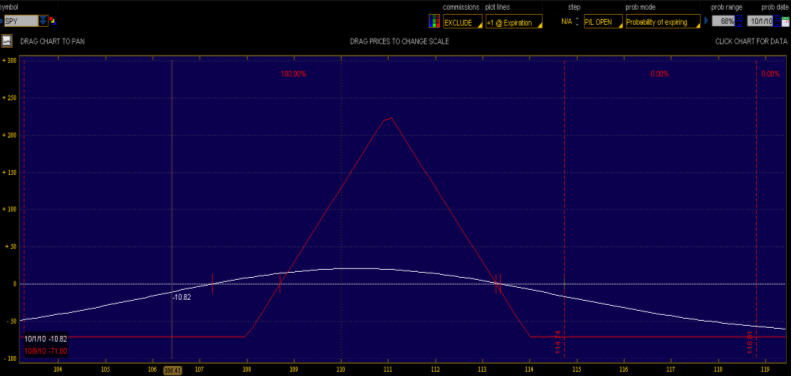
Obviously market conditions throughout the trading day Friday and next week will alter the prices and implied volatility of this trade. This should not be viewed as a trade that should be taken, but an example of what kind of returns are possible for option traders that want to use out of the butterflies with a directional bias.
The most exciting thing about a trade like this is that the trader can crisply define his/her risk. When the maximum risk is a specified amount, managing risk becomes almost arbitrary. A trader simply determines how much he/she is willing to risk/lose, and simply places the trade. A mere $142 risk could produce a potential profit well over $450! Keep in mind, that should price move within the confines of the outer strikes (wings) of the butterfly, it might make sense to take profits depending on the size of a trader’s position. Typically I like to take profits once price action has produced a gain of 10-20% depending on market conditions, time frame, and the strategy that I am using. After taking profits, I typically utilize contingent stop orders for the remainder of my position and manage it accordingly.
There are additional manipulations that could be made if price looked like it were going to break below the 108 strike level that would allow this trade to either remain essentially flat or potentially profit even more. Additionally, a similar trade using calls could be placed using the weekly call strikes 115/118/121 for a trader who was bullish. Regardless of a trader’s directional bias, the beauty of options is not only their ability to produce setups where risk is clearly defined, but the potential to manipulate a position in real time allows for fluctuations in price action or market conditions.
As for the direction of the market, who knows what the next six trading sessions will bring. Sometimes not trading is the best trade, but if you absolutely feel you must have some exposure, keep positions small, risk exposure tight, and do not hesitate to take profits – easier trades lie ahead.
If you would like to continue learning about the hidden potential options trading can provide please join my FREE Newsletter: www.OptionsTradingSignals.com
J.W. Jones is an independent options trader using multiple forms of analysis to guide his option trading strategies. Jones has an extensive background in portfolio analysis and analytics as well as risk analysis. J.W. strives to reach traders that are missing opportunities trading options and commits to writing content which is not only educational, but entertaining as well. Regular readers will develop the knowledge and skills to trade options competently over time. Jones focuses on writing spreads in situations where risk is clearly defined and high potential returns can be realized.
This article is intended solely for information purposes. The opinions are those of the author only. Please conduct further research and consult your financial advisor before making any investment/trading decision. No responsibility can be accepted for losses that may result as a consequence of trading on the basis of this analysis.
© 2005-2022 http://www.MarketOracle.co.uk - The Market Oracle is a FREE Daily Financial Markets Analysis & Forecasting online publication.