


Weekly Gold and Silver Technical Analysis Report - 14th Oct 07- Technically Precious with Merv
Commodities / Gold & Silver Oct 14, 2007 - 08:43 PM GMTBy: Merv_Burak

 Gold moved into new highs this week but not with any amount of enthusiasm. 15,312,000 ounces of gold sold short. Is that true? Boy, if someone had to cover that short there would be an upside explosion. But that's only dreaming, I think.
GOLD OPEN INTEREST
I've mentioned volume often but have not gotten into the topic of open interest. A discussion of open interest could be quite lengthy so I am only going to present, in as simple of a manner as I can, the open interest situation in gold at the present time.
In futures trading open interest is the number of outstanding contracts. The open interest in gold (COMEX Gold on the NYMEX) stands at 475,644 contracts as of the Thursday close. Note that volume and open interest are provided a day late so we do not have Friday's position but the betting is that open interest increased even further. The open interest on Aug 30 stood at 322,524 contracts. Therefore the number of contracts increased by 153,120 contracts during this 6 week period. So what you might say?
Since each contract represents 100 troy ounces of gold that means that the 6 week open interest increase represents 15,312,000 ounces of gold (or at Friday's gold price, $11.6 Billion). Still you say, so what?
Now the following is just my reading of my trusty little guide and I may not have the full story correct but here goes. During this period the price of gold has been on the move towards higher levels. This suggests that the pressure of trading was on the bullish side. During a period when you have a predominantly upside volume activity, pushing prices higher, to meet this demand for gold contracts we have gold being sold short, a lot of gold sold short. In fact during such up trend in prices the increase in the open interest represents the amount of gold sold short, in this case 153,120 contracts or 15,312,000 ounces of gold or $11.6 Billion worth. What does this mean, you should ask?
As I read it this means that with such heavy short selling over the past 6 weeks, this had the effect of keeping the price of gold from exploding on the up side. This may also mean that there is still to come this buying activity to cover the shorts, which should boost the price further -- but it's not all that clear.
There seems to be a lot of capital behind this short selling. If it continues it could have the effect of discouraging further buying and cause the price to move lower. Shorts could then cover under the radar screen of such lower trending price, as they did during the short sales and an upward trending price. But this starts to sound like manipulation of gold price. AH! Welcome to the real world.
Now who could it be that has such deep financial pockets to be able to withstand such huge transactions and potential losses should they lose their bet? That's where we get a whole lot of different conspiracy theories. I don't have a clue who could be involved so will leave it up to your efforts to search the internet and find out for yourselves, should you be further interested. One interesting site to start with could be www.gata.org .
Another way to look at this is that during this 6 week period gold increased in price by $80 or an average $40 per ounce (i.e. $4,000 per contract). With 153,120 contracts that's a total average loss so far of $612 Million. Who can afford THAT kind of loss? It sure isn't your average futures speculator. I put the conversation in the singular but of course the short selling was most likely done by more than one entity.
I've left a lot of information out of this discussion, such as mines selling future production, and the like, but you should get the drift, this shorting of gold over the past 6 weeks may be a terrific overhanging buying potential or it could be nothing other than the big boys playing around with pocket money.
As an aside, my open interest data only goes back 5 years but during that period, this past 6 week stretch has seen the sharpest increase in the shortest period of time in the open interest.
GOLD : LONG TERM
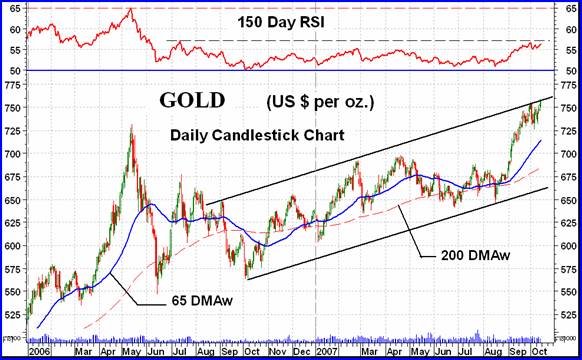
Over the past few weeks the overall long term picture has not changed much. From the P&F stand point the very long term resistance shown on the chart here a couple of weeks back has been broken on the up side while the normal long term P&F chart continues to show a bullish pattern. I'll try and remember to show the normal long term chart next week as it has changed, for the better, since last shown.
One can do a lot of things with a chart if one has a mind to. Here I have drawn an up trending channel which has trapped the price activity for over a year. Is it a valid channel? It's a valid channel as far as it goes but to really have significance the price must now drop towards the lower line, otherwise the channel will be nullified by an upside break. For now we still have the action well above a positive moving average line. As for the price momentum, well that seems to have hit a snag. Still positive but showing signs of topping out before breaking through that high from the July 2006 rally. The action still suggests a weak momentum although still positive. A weak momentum could very easily turn the price downward. However, for now I can only classify the long term as remaining BULLISH.
INTERMEDIATE TERM
The intermediate term P&F chart has set up a box pattern with the upper resistance at the $755 level and the lower support at the $730 level. An upside break, at $760, would project to $835 while a downside break, at $725, would project to $650 pending further up and down moves within the box.
Although the price has reached a new high during the week the action for the past few weeks looks more like a lateral action than an up or down one. The price needs to spurt higher through the recent highs and not by just a few dimes worth but by several dollars at least. The moving average is still quite positive while the momentum indicator is having some problems. The intermediate term momentum has been lethargic lately and has not confirmed the price move into new highs. The volume indicator has moved above recent highs but is still some distance from its April level. Price is far ahead of volume and not an encouraging sign. Despite the weakening indicators I will stick with a BULLISH rating for now.
SHORT TERM
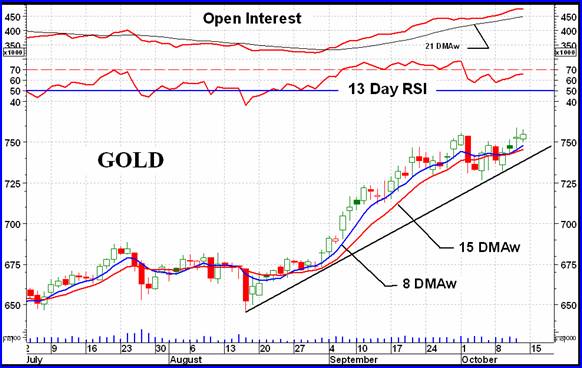
Shown on the short term chart is the open interest in gold futures. The steady increase in the open interest since its late Aug low is seen here but without the dramatic effect due to the vertical scale of the chart. When seen against the open interest for the past 5 years this past 6 week advance is quite dramatic.
Most of the week was on the up side but the move did not seem to have much enthusiasm to it. Anyway the move did stay above its short and very short term moving average lines and most importantly the very short term line stayed above the short term one. I mentioned last week that for a reversal to set in one of the things to look for is for that 8 DMAw line to cross below the 15 DMAw line. The other thing was if the price closed below the up trend line. Both are still okay. The short term momentum is still comfortably in its positive zone and not yet overbought BUT is not confirming the price new highs. The Stochastic Oscillator (not shown) is just about to enter its overbought zone so there is some hint that the move may be losing steam. There are different ways to interpret this SO indicator so some may have a different interpretation.
The direction of the move has been upwards and I will go with a continuation of the move. Watch for a reversal, however, with the moving averages crossing or the price closing below that up trend line.
NORTH AMERICAL GOLD INDICES
It was a good week all around for precious metal stocks. The major North American Indices all closed on the up side with gains 3.6% to 5.1%. It should go without saying that they all are now above their intermediate and long term moving average lines and the lines are all sloping in an upward direction. The hold out is still the momentum indicator. On the intermediate term the indicator is still under performing the Index moves for all 5 major Indices. However, for the long term the momentum indicators are now slightly on the side of confirmation. Somewhat of a quandary, usually it's the long term that is holding back while the intermediate term if confirming. So, in general we have the major North American Indices in BULLISH territory for the intermediate and long term, but with an intermediate term cautionary note.
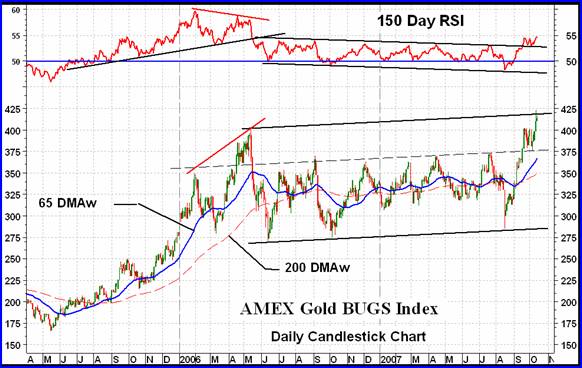
Taking a look at this week's Index, the AMEX Gold BUGS Index ( HUI ), we can draw funny lines on the chart. A couple of the lines show the negative divergence of the long term RSI versus the Index, resulting in the top last year. Another pair of lines that show the Index trapped inside a gentle up trending channel for a year and a half, with a secondary up trending line that was the upper channel line until recently. A third set of lines show the slightly negative trending long term momentum indicator trapped until recently. Now, what do we do with all these lines?
First, forget about the negative divergence lines, they are history, just learn from them. We have had a real strong Index move over the past couple of months. Long term momentum has finally also perked up. Everything says BULL market except for a proviso. I would like to see this Index CLOSE above 425 for a confirmation of the move, breaking above the upper channel trend line. In addition, I would like to see this long term momentum indicator move solidly through the 55% level. So, on the long term using the HUI Index I would say we ARE in a long term BULL market but until the above actions take place the bull is a cautionary bull which could turn on you.
MERV'S PRECIOUS METALS INDICES
We can draw similar up trending channel lines on the Merv's Composite Index of Precious Metals Indices as we did on the HUI above. On the Composite, however, this past week's action DID break through the upper channel line with gusto, into new all time highs. Although the Index is stronger than the HUI Index its long term momentum is still lagging. The intermediate term momentum indicator is showing some strength moving into new year and a half highs but is still a long way from the May 2006 peak. So let's see what this coming week will bring And keep, our fingers crossed for more upside activity.
MERV'S GOLD & SILVER 160 INDEX
The overall universe of 160 stocks did okay on the week with an average gain of 5.3%. Unlike the majors or the Merv's Qual-Gold Index the overall universe of precious metal stocks has not yet moved into new high territory. What this suggests, as I have been mentioning for the past few weeks, is that the move so far has been in the quality stocks and not the overall industry. Yes, the other stocks are moving higher but not with the strength or gusto of the quality issues. This week we see many great gainers and if this continues for another few weeks we could have that shift of sentiment towards the speculatives that define a real bull market in the universe and not just a few quality issues. Until that speculative sentiment arrives ALL stock moves are in danger.
To go with that 5.3% gain we had 122 winners on the week (76%) and 33 losers (21%). In addition, the summation of individual stock ratings has moved into the BULLISH camp for all three time periods. We are at 74% BULL for the short term, 81% BULL for the intermediate term and 54% BULL for the long term.
As for the charts and indicators the Index is above both intermediate and long term moving average lines and both lines are pointing upwards. Both momentum indicators are in their positive zones and heading higher. The only cautionary indicator is the strength of the momentum indicators. They are still lagging the action of the Index. However, we do not determine trend by what the momentum is saying as it could change as the Index continues on its way. The major deciding factor is the action of the Index itself, and for now it is positive for both time periods. Therefore I must rate the Index as BULLISH for both the intermediate and long term.
MERV'S QUAL-GOLD INDEX : MERV'S SPEC-GOLD INDEX : MERV'S GAMB-GOLD INDEX
The Gamb-Gold Index finally pulled ahead of the crowd this week but only because of a few good movers in the Index. We still have the highest quality Index with the most winners and going downwards from there to the lowest quality Index with the lowest number of winners. The Qual-Gold Index advanced by 5.7% and had 27 winners (90%). The Spec-Gold Index gained 3.7% on the week and had 25 winners (83%). The Gamb-Gold Index gained 7.2% (the best of the Merv's Indices this week) and had 22 winners (73%). As a teaser, here is the table of technical information and ratings for the Merv's Gamb-Gold Index this week. The tables for the other Indices are available in the subscriber's section of Merv's Precious Metals Central .
As mentioned earlier, the Qual-Gold Index is performing similar to the majors, moving into new high territory. The Spec-Gold Index is just below its previous 2007 highs while the Gamb-Gold Index is just a little bit further behind its previous high. Another week or two such as this past one and the Gamb-Gold could once more take the lead, but that is for the future.
Looking at the charts and indicators we see a similar story for all three of the sector Indices. Both moving average are pointing upwards with their respective Indices trading above the averages. The intermediate and long term momentum indicators for all three Indices are positive and heading higher BUT all are under performing their respective Indices. BULLISH all around but with caution.
SILVER
Silver had a good week versus gold with a 3.0% gain (gold only had a 0.9% gain). The move took silver back to its high of two weeks ago. Intermediate term momentum, although positive, has been slightly lagging the move. Volume action just barely kept pace. Although I do not profess to be a futures expert I cannot find the same sharp increase in the open interest in silver as I see in gold. Yes, the open interest has increased during the past several weeks of price advance BUT it has been doing the same several times in the past and this trend is no different. Also the open interest total has not gone into unchartered territory. It is below its previous recent peaks. So, silver can be rated as BULLISH on both the intermediate and long term but with the same caution as for gold and the Merv's Indices, due to the lagging of the momentum action.
MERV'S QUAL-SILVER INDEX : MERV'S SPEC-SILVER INDEX
In the silver sector it was the turn of the speculative silver stocks to move this week. The Qual-Silver Index gained 3.4% on the week while the Spec-Silver gained 6.8%. Both Indices are trading above their intermediate and long term moving average lines with the lines pointing upward. Both momentum indicators for both Indices are positive and moving higher. Therefore both Indices can be rated as BULLISH for both time periods.
Merv's Precious Metals Indices Table
I guess that's it for another week. For those who wish information on uranium stocks please visit my uranium blog on http://techuranium.blogspot.com . The week-end commentary and table of technical information is not yet updated but should be by late Sunday afternoon.
By Merv Burak, CMT
Hudson Aero/Systems Inc.
Technical Information Group
for Merv's Precious Metals Central
Web: www.themarkettraders.com
e-mail: merv@themarkettraders.com
During the day Merv practices his engineering profession as a Consulting Aerospace Engineer. Once the sun goes down and night descends upon the earth Merv dons his other hat as a Chartered Market Technician ( CMT ) and tries to decipher what's going on in the securities markets. As an underground surveyor in the gold mines of Canada 's Northwest Territories in his youth, Merv has a soft spot for the gold industry and has developed several Gold Indices reflecting different aspects of the industry. As a basically lazy individual Merv's driving focus is to KEEP IT SIMPLE .
To find out more about Merv's various Gold Indices and component stocks, please visit www.themarkettraders.com and click on Merv's Precious Metals Central . There you will find samples of the Indices and their component stocks plus other publications of interest to gold investors. While at the themarkettraders.com web site please take the time to check out the Energy Central site and the various Merv's Energy Tables for the most comprehensive survey of energy stocks on the internet. Before you invest, Always check your market timing with a Qualified Professional Market Technician
Merv Burak Archive |
© 2005-2022 http://www.MarketOracle.co.uk - The Market Oracle is a FREE Daily Financial Markets Analysis & Forecasting online publication.