


Stock Market Elliott Wave Analysis and Forecast for Week Starting 24th Jan
Stock-Markets / Stock Markets 2011 Jan 22, 2011 - 01:56 PM GMTBy: Tony_Caldaro

 The US markets closed out the week with their first weekly decline on friday, after seven consecutive weekly gains. Economic reports were good: seven up, three down, and one flat. Year end earnings reports, thus far, have been better than expected. On the economic front the NY FED, building permits, existing homes sales, leading indicators, weekly jobless claims, the monetary base and the WLEI all improved. Housing starts, the Philly FED and the M1-multiplier was down, while the NAHB housing index remained flat. For the week the SPX/DOW were mixed, and the NDX/NAZ were -2.4%. Asian markets were mostly lower -1.3%, European markets were mixed +0.8%, the Commodity equity group was mixed -1.1%, and the DJ World index was -0.8%. Bonds were -0.6%, Crude slid 3.2%, Gold lost 1.2%, and the USD declined 1.2%. Next week the FED concludes its two day FOMC meeting on wednesday, two days before the Q4 GDP report on friday.
LONG TERM: bull market
This week the SPX/DOW/NDX/NAZ all made new bull markets highs. In fact, the NDX has already exceeded its 2007 high by 4.2%. Growth stocks have clearly been the leaders during this 22 month bull market. Our long term wave count continues to unfold as expected. The bear market ended in Mar09 at SPX 667. Five Major waves then unfolded to conclude Primary wave I at SPX 1220 in Apr10. This was followed by a Primary wave II correction to SPX 1011 by July10. After that the market embarked on a six month Major wave 1 uptrend to kick off Primary wave III. Typically during bull markets each uptrend makes new bull market highs, and that is exactly what has transpired for nearly two years now. Primary wave III will also consist on five Major waves just like Primary wave I. We’re expecting Primary wave III to top this year above SPX 1500. This will then be followed by a significant Primary wave IV correction into the fourth quarter, and then, Primary wave V and the bull market should conclude early next year. Still lots to go on the upside in this bull market.
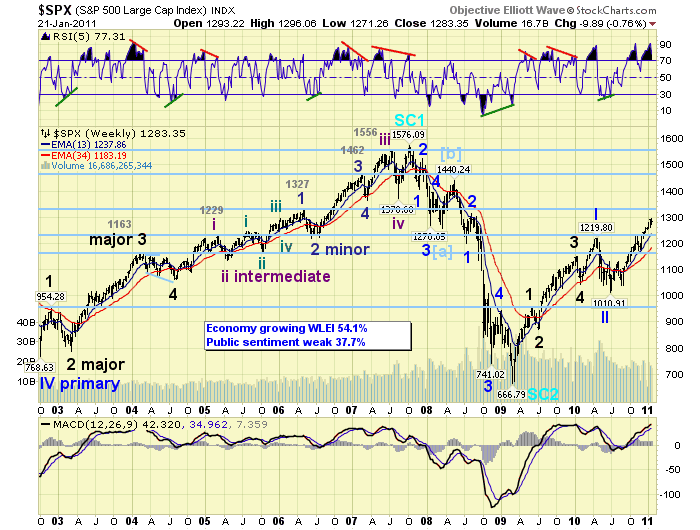
MEDIUM TERM: uptrend may have topped at SPX 1296
After the Primary wave II low in early July at SPX 1011 the market embarked on a lengthy six month uptrend (wave). We anticipated in September this wave would last about six months based upon the characteristics this bull market had displayed thus far. Each bull/bear market has its own characteristics. Our September projection was for the SPX to hit the OEW 1313 pivot in Jan11. This is still possible. http://caldaro.wordpress.com/2010/09/26/spx-bull-market-projection/.
During this Major wave 1 uptrend we have counted five Intermediate waves: Int. 1 SPX 1129, Int. 2 SPX 1040, Int. 3 SPX 1227, Int. 4 SPX 1173, and Int. 5 SPX 1296 thus far. Since Int. wave 3 is longer than Int. wave 1, Int. wave 5 can continue to extend with no change in this uptrend count. At the SPX 1296 high the market ran into two clusters of resistance. First, the fibonacci cluster between SPX 1289 and 1306. This was detailed in last weekend’s report. Second, the OEW pivot cluster 1291, 1303 and 1313. This is quite a heavy resistance area to penetrate, especially after a six month uptrend. We remain cautious medium term on the stock market.
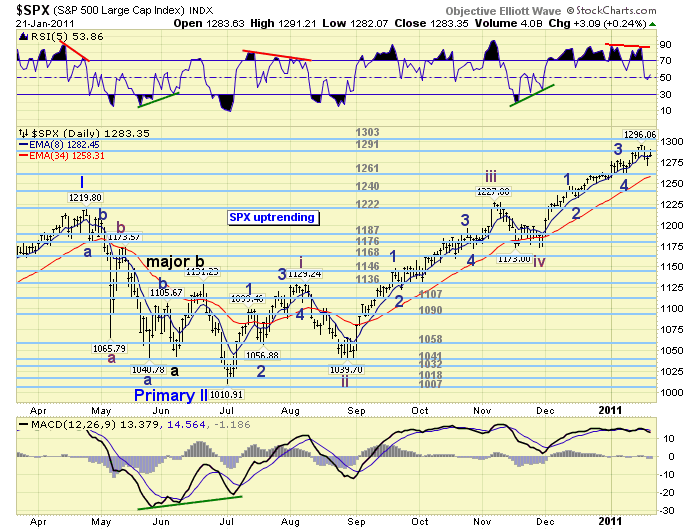
SHORT TERM
Support for the SPX is at 1261 and then 1240, with resistance at 1291 and then 1303. Short term momentum spiked to slightly overbought on friday morning then pulled back to neutral at the close. We have been counting this last rally, Int. wave five from SPX 1173, as a potentially completed five Minor wave structure: Minor wave 1 SPX 1247, Minor 2 SPX 1233, Minor 3 SPX 1278, Minor 4 SPX 1262, and Minor 5 SPX 1296. Based upon the wave structure there is still a possibility for the SPX to rise to 1307 before this short term count would become invalid. We can also count five Minute waves up from the Minor wave 4 low at SPX 1262: Minute 1 SPX 1277, Minute 2 SPX 1270, Minute 3 SPX 1287, Minute 4 SPX 1280 and Minute 5 SPX 1296. This count also allows, with an extension, a possible rally to SPX 1307.
After the SPX 1296 high, however, the market had the largest pullback of all of Int. wave five. This 25 point pullback was much larger than the four previous pullbacks between 13 and 16 points. This clearly is not a good sign going forward medium term. Also, we currently have negative RSI divergences on the hourly/daily charts and a weakening MACD. The NYAD (market breadth) is also displaying a negative RSI divergence on its daily chart. In other areas the technicals do not look bad at all. All nine SPX sectors remain in uptrends, and only two of the fifteen world markets we track are in confirmed downtrends.
The short term OEW charts are at neutral with the SPX closing just under short term support at 1284. More important support is at the 1262, 1240 and 1222 OEW pivots. A decline to the 1262 pivot, and lower, would probably generate a downtrend confirmation. Support for a Major wave 2 correction would be at the OEW pivot cluster of 1168, 1176 and 1187. This is also in the area of the EW support of Int. wave four (SPX 1173). If this market can recapture the 1291 pivot by closing above it, a rally into the 1303 and 1313 pivots is then possible. Best to your trading!
FOREIGN MARKETS
Asian markets were mostly lower (-1.3%) on the week with only the downtrending BSE registering a gain (+0.8%). China’s SSEC is also downtrending.
European markets were mixed on the week but averaged a gain of 0.8% due to the 4.3% rally in the IBEX. All five indices are in uptrends.
The Commodity equity group was mixed on the week for a net loss of 1.1%. All uptrends here as well.
The uptrending DJ World index lost 0.8% on the week.
COMMODITIES
Bonds were -0.6% on the week as their downtrend continues. For a few weeks it looked like 10/30 YR yields had topped for this uptrend. This week the 30YR hit a new high, while the 10YR has been consolidating at high levels for several weeks. Looks like more weakness ahead for the bond market.
Crude remained volatile as always losing 3.2% on the week. Its five month uptrend displays a negative RSI divergence on both the daily and weekly charts at recent highs. The downtrending USD appears to be the only factor keeping it from entering a correction.
Gold continued its downtrend losing 1.2% on the week. Both Gold and Silver are in confirmed downtrends after six month uptrends and new bull market highs. The wave patterns suggest the correction will end in February between $1265 and $1315 for Gold, and about $23 and $25 for Silver. Then a new uptrend should unfold taking them both to new bull market highs into the spring. Gold has been in a long term uptrend for nine years, soon to be ten, and on its way to thirteen.
The USD (-1.2%) continues to vacillate from uptrend to downtrend every several weeks. This has been ongoing since the five month downtrend low in early November. The EUR (+1.8%) has been doing the same thing, only in the opposite direction of course. Other currencies, i.e. AUD, CAD, CHF, GBP and JPY have been trending with much more consistently.
NEXT WEEK
FOMC week, in recent years, is always an important one for the equity markets. Trend continuations or reversals often occur during this week. The FED meets on tuesday/wednesday with a statement around 2:00 wednesday. Tuesday also kicks off the economic week with Case-Shiller, the FHFA housing index and Consumer confidence. On wednesday New home sales will be reported. Thursday offers the weekly Jobless claims, Durable goods and Pending home sales. Then on friday, Q4 GDP est. at +3.8% and Consumer confidence. Enjoy your weekend/week.
CHARTS: http://stockcharts.com/def/servlet/Favorites.CServlet?obj=ID1606987
http://caldaroew.spaces.live.com
After about 40 years of investing in the markets one learns that the markets are constantly changing, not only in price, but in what drives the markets. In the 1960s, the Nifty Fifty were the leaders of the stock market. In the 1970s, stock selection using Technical Analysis was important, as the market stayed with a trading range for the entire decade. In the 1980s, the market finally broke out of it doldrums, as the DOW broke through 1100 in 1982, and launched the greatest bull market on record.
Sharing is an important aspect of a life. Over 100 people have joined our group, from all walks of life, covering twenty three countries across the globe. It's been the most fun I have ever had in the market. Sharing uncommon knowledge, with investors. In hope of aiding them in finding their financial independence.
Copyright © 2011 Tony Caldaro - All Rights Reserved Disclaimer: The above is a matter of opinion provided for general information purposes only and is not intended as investment advice. Information and analysis above are derived from sources and utilising methods believed to be reliable, but we cannot accept responsibility for any losses you may incur as a result of this analysis. Individuals should consult with their personal financial advisors.
© 2005-2022 http://www.MarketOracle.co.uk - The Market Oracle is a FREE Daily Financial Markets Analysis & Forecasting online publication.