


Stock Market Elliott Wave Analysis and Forecast for Week Starting 31st Jan
Stock-Markets / Stock Markets 2011 Jan 30, 2011 - 05:39 AM GMTBy: Tony_Caldaro

 During the past six trading days the market had cleared the Ops-Ex and the FOMC potential obstacles, but on friday ran into serious trouble with a lower than expected Q4 GDP. Just after the open on friday the SPX was at a new bull market high and up 1.6% on the week. After friday’s close it ended down 0.6% for the week. This week’s economic reports were more mixed than in recent weeks: seven improving and five weakening. The decliners were Case-Shiller housing prices, durable goods, the M1-multiplier, the WLEI, and a rise in jobless claims.
The improving reports were consumer confidence/sentiment, new/pending homes sales, FHFA housing prices, Q4 GDP, and the monetary base. For the week the SPX/DOW were -0.5%, and the NDX/NAZ were mixed. Asian markets were mixed -0.4%, European markets were mostly lower -0.6%, the Commodity equity group was mixed -0.7%, and the DJ World index was -0.1%. Bonds were +0.8%, Crude gained 0.4%, Gold slid 0.6%, and the USD was -0.1%. Next week we have the Payrolls report, along with the Chicago PMI, ISM, PCE prices and Auto sales.
LONG TERM: bull market
This week we will review how our basic weekly technical indicators, (RSI and MACD), respond during bull and bear markets. We have covered this before, from time to time, but after a six month uptrend it is worth another look. In review of the weekly chart below we can easily identify when a bull market was unfolding, and a bear market, just by looking at the RSI and MACD. For example, the RSI typically gets extremely overbought during uptrends in bull markets and barely oversold during downtrends. During bear markets, however, the reverse effect occurs: extremely oversold during downtrends and barely overbought during uptrends. The MACD is a bit different. During bull markets the MACD vacillates between extremely overbought and neutral. While during bear markets the opposite again occurs: it vacillates between extremely oversold and neutral. A simple review of the weekly SPX chart clearly displays a bull market with bullish technicals since the March 2009 low. This technique can be applied to any market, stock, or asset class.
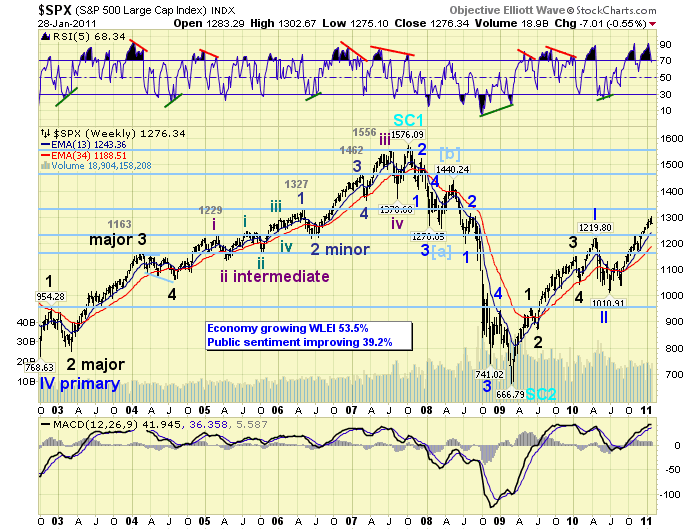
Objective Elliott Wave (OEW), however, is quite a bit more comprehensive than just a couple of weekly indicators. In OEW we first, and foremost, track the long term and medium term trends. These trends are created by market movement and are confirmed, quantitatively, by OEW. Long term trends, quite naturally, are usually bull and bears markets lasting for years. Medium term trends usually last only a few months, and are the important waves that create these bull and bear markets. As the waves are quantified by OEW we label them depending upon which is the most probable pattern within the long term uptrend or downtrend. When the pattern is complete, typically, a bull or bear markets ends.
For more than a year now this market has been in a confirmed long term uptrend: a bull market. We have been tracking the medium term trends and labeling the waves accordingly. Referring back to the weekly chart above one can observe five Major waves up, from the Mar09 SPX 667 bear market low, into the Apr10 at SPX 1220. We labeled these five Major waves the completion of Primary wave I. A three month 17% correction followed into a July10 low of SPX 1011. We labeled this correction Primary wave II. After that low we entered Primary wave III, and specifically Major wave 1 of Primary wave III. Yes, we are expecting Primary wave III to also divide into five Major waves, just like Primary wave I. And, thus far, that is exactly what is occurring!
In September we posted a tentative projection for the rest of the bull market, when the SPX was trading at 1149. You can review it here: http://caldaro.wordpress.com/2010/09/26/spx-bull-market-projection/. Our first projection was for a Major wave 1 six month uptrend, from the July10 SPX 1011 low until Jan11 and topping around the OEW 1313 pivot. On friday the SPX came within three points of hitting the range of that pivot when it hit the 1303 pivot. Our second projection called for a correction of about 9% into a Feb10 low. Since we are already heading into the last trading day of the month on monday we’ll see how these two projections work out in the weeks ahead. Overall we’re expecting the bull market to continue with a retest of the 2007 highs, or higher, in early 2012.
MEDIUM TERM: uptrend weakening, high SPX 1303
What a difference one day can make. Heading into friday we were tracking this six month uptrend as it continually drifted higher and higher. We had counted five Intermediate waves, as noted on the chart below, and since late November we were in the fifth wave. We had counted five Minor waves, within Intermediate wave five, and we were reaching the limit of Minor wave 5 at SPX 1307 under the present count. We had noted, for several weeks now, the strong resistance of the fibonacci cluster between SPX 1289 and 1306. Also, the liikely difficulty this market would have dealing with the cluster of OEW pivots between 1291 and 1313 after a six month uptrend. On friday we received our first OEW leading indication that the uptrend may have ended friday morning at SPX 1303.
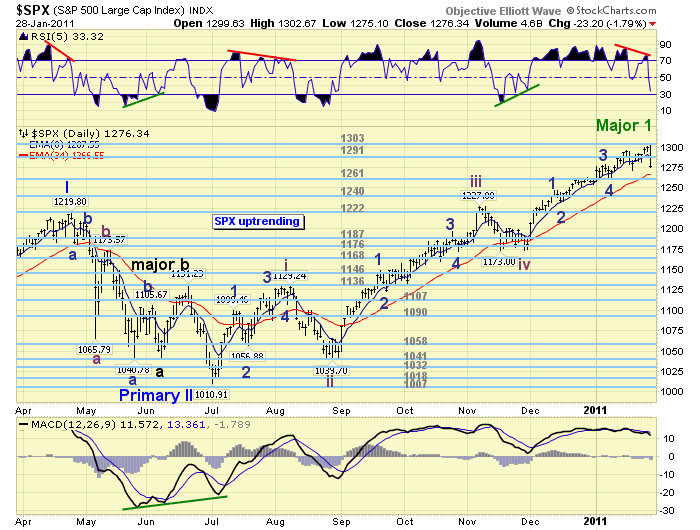
At the current high of SPX 1303, Major wave 1 of Primary wave III is within three SPX points of equaling Major wave 1 of Primary wave I, (292 vs 289 pts). Major wave 1 of Primary wave III equals Major wave 3 of Primary I in time, (six months). And, Intermediate wave five is within three SPX points of a 0.618 fibonacci relationship to Intermediate waves one through three. This uptrend just hit the limits, 289 SPX points and six months, in the characteristics of this bull market.
SHORT TERM
Support for the SPX is now at 1261 and then 1240, with resistance at 1291 and then 1303. Short term momentum ended friday at extremely oversold. On friday, as noted above, we received the first leading indication of an Major wave 1 uptrend top. We posted the tentative “green” labeling on the SPX charts. Naturally OEW will need to confirm the downtrend before the labeling is upgraded to the Major wave black.
The current chart pattern suggests OEW will likely confirm a Major wave 2 downtrend when the SPX breaks through the OEW 1261 pivot. If not before! It is day to day heading into next week. Should the downtrend be confirmed we would expect a correcton of about 9% in the SPX. This suggests a decline to around SPX 1186 and the OEW 1187 pivot. Since the previous fourth wave of a lesser degree, Intermediate wave four, bottomed at SPX 1173 we would appear to have good downtrend support within the range of the OEW 1168, 1176 and 1187 pivot cluster. We could effectively trade from one OEW pivot cluster to another.
A slightly different interpretation of this bull market’s characteristics, would suggest a more moderate 7% correction finding support between SPX 1209 and 1219. This is closer to the projected Major wave 2 support at the 1222 pivot. The shape of the correction is likely to be another zigzag. However, it may take any of the normal wave two forms since it is the first correction within a new series of Major waves.
On the upside. Should the SPX hold the 1261 pivot without confirming a downtrend, and rally back above the 1291 pivot on a closing basis, this uptrend could start extending. This is quite rare, but it is possible. On the downside. A break below the 1261 pivot would likely confirm a downtrend. We continue to remain cautious on this market, medium term, as we have since SPX 1296 was hit a couple of weeks ago. Best to your trading!
FOREIGN MARKETS
Asian markets were mixed on the week for a net loss of 0.4%. The loss was mostly from India’s BSE (-3.2%) and Hong Kong’s HSI (-1.1%). The other three indices we track were up on the week. The BSE and China’s SSEC remain in downtrends.
European markets were mostly lower on the week for a net loss of 0.6%. Germany’s DAX was the only one of the five we track to display a gain. All five are still in uptrends.
The Commodity equity group was mixed for a net loss of 0.7%. Brazil’s BVSP tumbled 3.5% on the week and is now in a confirmed downtrend.
The DJ World index slipped 0.1% on the week and remains uptrending.
COMMODITIES
Bonds (+0.8%) now look like they are about to confirm an uptrend after bouncing around for most of the week and ending on a positive note on friday. The rise in 30YR yields stopped at long term resistance. And the 10YR yield topped at 3.57% about six weeks ago.
Crude (+0.4%) continues to be one heck of a volatile market. Currently we have Crude in a confirmed downtrend from the January $93.00 high. But friday it rallied from a downtrend low of $85 to a high of $90, and closed at $89.
Gold (-0.6%) hit what appears to be a downtrend low at $1308 on friday, with a positive daily RSI divergence and an extremely oversold MACD. Silver (+1.8%) did likewise. This potential count will be invalidated with a decline below the recent $1308 low.
The downtrending USD was quite oversold short term and bounced on friday to end the week -0.1%. The uptrending EUR was flat on the week, and the potentially uptrending JPY gained 0.6%.
NEXT WEEK
Busy economic week ahead. Monday kicks it off with Personal income/spending and PCE prices at 8:30, then the Chicago PMI at 9:45. On tuesday, Construction spending and ISM manufacturing at 10:00, then monthly Auto sales in the afternoon. Wednesday the ADP employment report. On thursday weekly Jobless claims, Q4 Productivity, Factory orders and ISM services. Then on friday, the monthly Payrolls report with the Unemployment rate. The FED returns to the circuit with speeches from FED governor Duke in NC tuesday evening. Then FED chairman Bernanke addresses the Natl Press Club at a Wash, DC luncheon. Best to your week! Should be an interesting one.
CHARTS: http://stockcharts.com/def/servlet/Favorites.CServlet?obj=ID1606987
http://caldaroew.spaces.live.com
After about 40 years of investing in the markets one learns that the markets are constantly changing, not only in price, but in what drives the markets. In the 1960s, the Nifty Fifty were the leaders of the stock market. In the 1970s, stock selection using Technical Analysis was important, as the market stayed with a trading range for the entire decade. In the 1980s, the market finally broke out of it doldrums, as the DOW broke through 1100 in 1982, and launched the greatest bull market on record.
Sharing is an important aspect of a life. Over 100 people have joined our group, from all walks of life, covering twenty three countries across the globe. It's been the most fun I have ever had in the market. Sharing uncommon knowledge, with investors. In hope of aiding them in finding their financial independence.
Copyright © 2010 Tony Caldaro - All Rights Reserved Disclaimer: The above is a matter of opinion provided for general information purposes only and is not intended as investment advice. Information and analysis above are derived from sources and utilising methods believed to be reliable, but we cannot accept responsibility for any losses you may incur as a result of this analysis. Individuals should consult with their personal financial advisors.
© 2005-2022 http://www.MarketOracle.co.uk - The Market Oracle is a FREE Daily Financial Markets Analysis & Forecasting online publication.