


Stock Market Ending Diagonal Dead Ahead
Stock-Markets / Stock Markets 2011 Feb 01, 2011 - 04:34 AM GMTBy: Gordon_T_Long

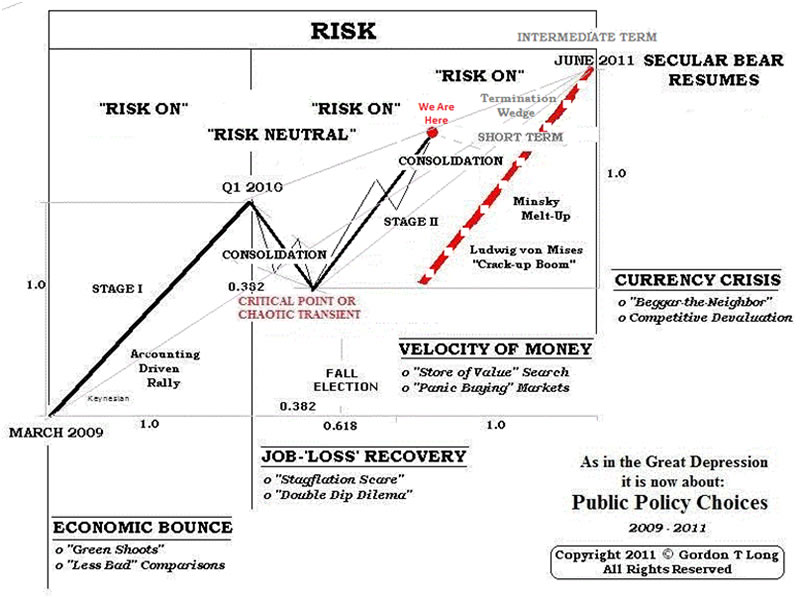
 We appear to have a 'rolling top' with broad based weakening analytics and cascading warning signals. This behavior is often seen near major tops. The Friday 01-28-11 sell-off is the initiation of a short term correction and consolidation before we put in a final new high as part of this final topping formation and long term right shoulder construction pattern.
The market action since March 2009 is a bear market counter rally that will end with a classic ending diagonal pattern. The Bear Market which started in 2000 will resume in full force by the spring of 2011.
Highlight examples of weakening analytics and warning signals are as follows:
- Dow Theory non-confirmation between the Dow Industrials and the Trannies
- Inter-market Divergence with new highs in the Blue Chip DOW Industrials with lower closes in the S&P 500, Nasdaq, Russell 2000 and Trannies
- Extreme Bullish Sentiment indicators
- VIX Sell Signal
- Confirmed Hindenberg Omen from December
- Weakening Breadth - 10 DMA A/D Line versus NYSE, NDX and Russell 2000 price.
- Rising Termination Wedge pattern in the Industrials and S&P 500 since the July 2010 lows.
CURRENT MACRO EXPECTATIONS
OUR CURRENT MACRO EXPECTATIONS FOR FINANCIAL EQUITY MARKETS
The following schematic best represents the US S&P 500 Stock Index
SIMPLE GANN ANALYSIS
ELLIOTT WAVE COUNT
CHANNELS ANALYSIS
S&P 500 TARGETS
Near Term Support
We see the near term support to be approximately 1230 on the S&P 500. There is a possibility the sell off may gain momentum and find support at the lower end of the band (see bottom chart) at 1169 but we are skeptical of this because it is unsupported by Gann Analysis.
Intermediate Term Top
Our target for an Intermediate top is 1341 on the S&P 500.
Time Frame
We presently see this Bear Market counter rally which started in March 2009 ending 2011.45.
This approximates June 13th, 2011
SIGNUP FOR THIS FREE MONTHLY ANALYSIS
E-mail: lcmgroupe@comcast.net
Type in the Subject Line: TA Newsletter
Download the complete 39 Page February edition at: February 2011 Market Analytics
Gordon T Long gtlong@comcast.net Web: Tipping Points Mr. Long is a former executive with IBM & Motorola, a principle in a high tech start-up and founder of a private Venture Capital fund. He is presently involved in Private Equity Placements Internationally in addition to proprietary trading that involves the development & application of Chaos Theory and Mandelbrot Generator algorithms.
Gordon T Long is not a registered advisor and does not give investment advice. His comments are an expression of opinion only and should not be construed in any manner whatsoever as recommendations to buy or sell a stock, option, future, bond, commodity or any other financial instrument at any time. While he believes his statements to be true, they always depend on the reliability of his own credible sources. Of course, he recommends that you consult with a qualified investment advisor, one licensed by appropriate regulatory agencies in your legal jurisdiction, before making any investment decisions, and barring that, we encourage you confirm the facts on your own before making important investment commitments.
© Copyright 2010 Gordon T Long. The information herein was obtained from sources which Mr. Long believes reliable, but he does not guarantee its accuracy. None of the information, advertisements, website links, or any opinions expressed constitutes a solicitation of the purchase or sale of any securities or commodities. Please note that Mr. Long may already have invested or may from time to time invest in securities that are recommended or otherwise covered on this website. Mr. Long does not intend to disclose the extent of any current holdings or future transactions with respect to any particular security. You should consider this possibility before investing in any security based upon statements and information contained in any report, post, comment or recommendation you receive from him.
© 2005-2022 http://www.MarketOracle.co.uk - The Market Oracle is a FREE Daily Financial Markets Analysis & Forecasting online publication.