


U.S. January Employment Report Suggests Continutation of Fed Easy Monetary Policy Stance
Economics / US Economy Feb 05, 2011 - 05:10 AM GMTBy: Asha_Bangalore

 The January employment report includes special factors, so the format of today's commentary is different from the procedure we follow for each month's employment report. The comment starts with a discussion of the special factors, followed by a conclusion, and ends with an analysis of customary details.
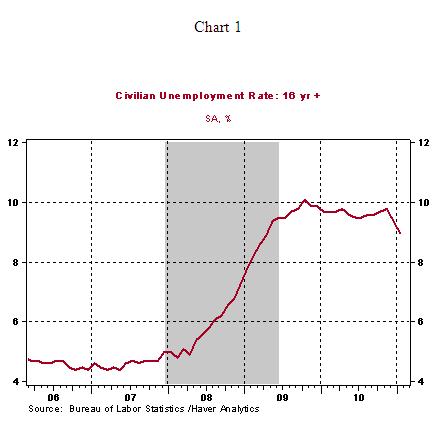
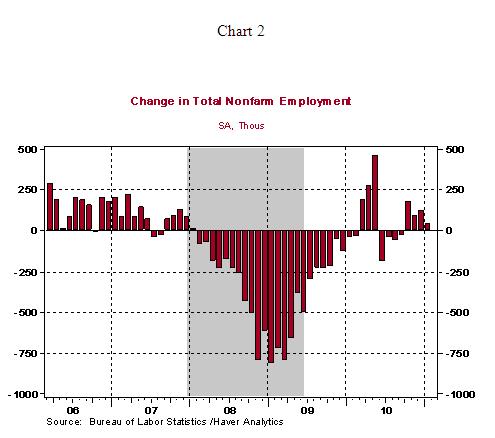
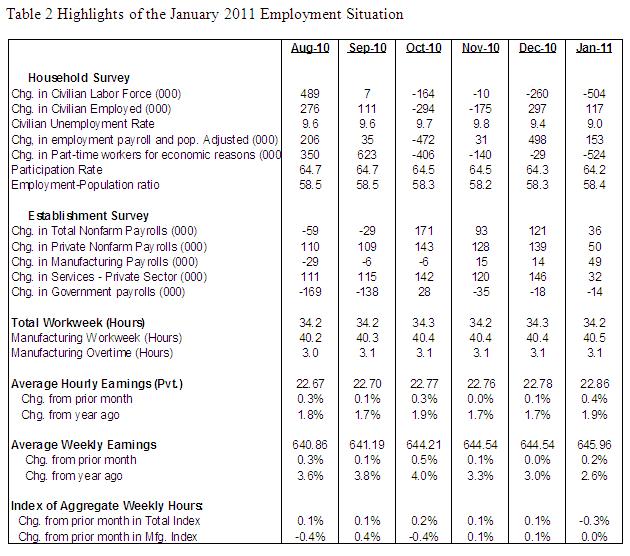
The employment report for each month is compiled from two surveys - household survey and establishment survey. The unemployment rate, derived from the household survey, fell to 9.0% in January from 9.4% in December and 9.8% in November (see Chart 1). This is significantly bullish, given that the jobless rate has declined eight-tenths of a percentage point in a short span of two months. At the same time, overall payroll employment rose only 36,000 in January (see Chart 2) and private sector payrolls climbed 50,000 (these estimates are from the establishment survey). At first blush, these headlines present a mixed message.
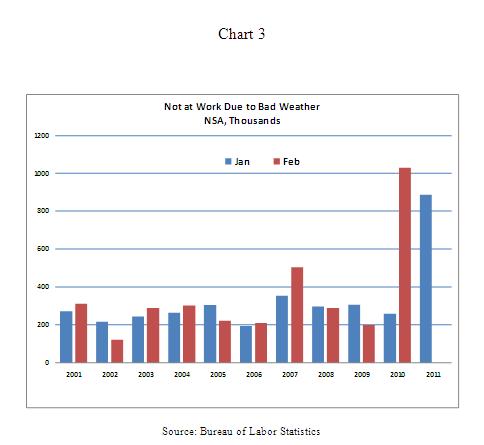
However, there are three aspects to note that will help in interpreting today's report: (1) Inclement weather distorted survey results. The Bureau of Labor Statistics (BLS) indicated that 886,000 people were not at work in January due to bad weather as per the household survey (see Chart 3). The count for January 2011 is high compared with similar tallies reported over the past decade for the January-February months, with the exception of the number reported for February 2010. The status of these people in the labor force is still classified as "employed" in the household survey. However, they would not be counted in the establishment survey. The impact on the establishment survey count is a reduction in payrolls but the precise number is unclear.
(2) In January of each year, the BLS includes population adjustments in the estimates of the labor force which is an additional source of difficulty for interpretation of data. (3) Payroll estimates, from the establishment survey, include benchmark revisions going back to April 2009. These three factors make it challenging to draw firm conclusions from the data published today; essentially, we need 2-3 months of additional employment data to get a clean assessment of labor market conditions.
In the meanwhile, we can use other information from the BLS to evaluate the current status of the labor market. Table 1 is a comparison of data from the establishment survey and adjusted household survey numbers such that comparisons are on an apples-to-apples basis. Employment estimates from the two surveys differ because they are based on different concepts of employment and estimation methods. Three sets of numbers are listed in the table - payroll numbers as we see in the headlines of the report and adjustments to the household survey estimates after adjusting for population changes and consistent with the payroll survey concept of employment.
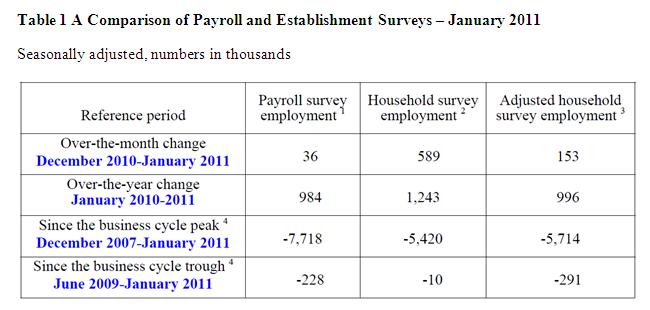
Source: http://www.bls.gov/web/empsit/ces_cps_trends.pdf.
1 - Payroll estimates for December 2010 and January 2011 are subject to revision.
2 - Adjusted for changes in population.
3 - Adjusted for changes in the population and the concept of employment in the payroll survey.
4 - The National Bureau of Economic Research established that the recession began in December 2007 and ended in June 2009. Therefore, the peak of the prior business cycle is December 2007 and trough of the current business cycle is June 2009.
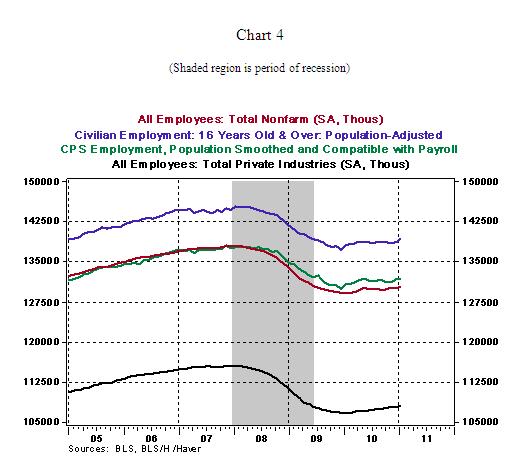
The main takeaway from these numbers is that the number of jobs created since the recovery commenced in June 2009 is troubling and raises the level of concern for policymakers. As shown in table 1, during the 19 months of economic recovery total payroll employment has dropped 284,000, while private sector payrolls have risen only 94,000 (not shown in Table 1). Employment, as measured by adjustments to household survey data, also show declines. Chart 4 illustrates the level of employment as noted in the three measures of employment in Table 1 and also includes private sector employment. The most compelling point of Chart 4 is that the level of employment, irrespective of how it is measured, is still significantly below the prior peak even after 19 months of economic growth.
Therefore, data from both surveys strongly suggest that job creation is proceeding in the desirable direction but at a tepid pace such that it is does not offer sufficient justification for the Fed to end the $600 billion purchase of Treasury securities (also known as QE2) before the planned expiration date of June 2011. In light of this information, it is hardly a astonishing that Chairman Bernanke, indicated the following in his speech on February 3, 2011: "Until we see a sustained period of stronger job creation, we cannot consider the recovery to be truly established."
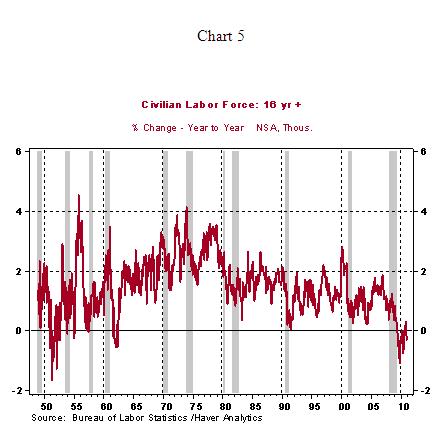
Proceeding to details from the household survey, the labor force fell 504,000 in January after posting declines during each month since October and a nearly steady reading in September. Typically, in a growing economy, the labor force grows. As Chart 5 indicates, the labor force has failed to post a meaningful year-to-year increase after 19 months of economic growth. The current trend is a new feature in the entire post-war period. It should not be surprising to see an expansion of the labor force in the months ahead and a slightly higher unemployment rate, if employment falls short of the growth in the labor force.
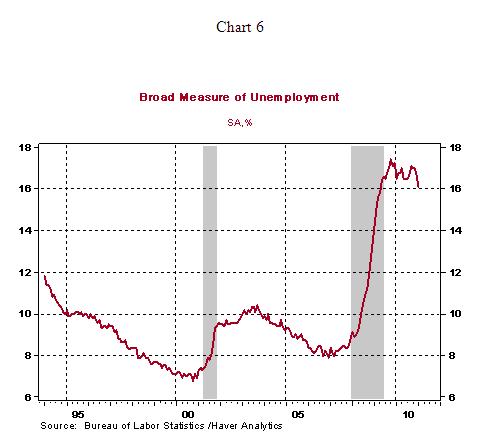
The participation rate inched down in January (64.2% vs. 64.3% in December) and the employment-population ration edged up (58.4% vs. 58.3% in December). The broader measure of unemployment fell to 16.1% in January from 16.7% in December (see Chart 6), the lowest since April 2009. The median duration of unemployment declined to 21.8 weeks from 22.4 weeks in December. The percent of the unemployed who have been unemployed for six months and over fell to 43.8% in January from 44.3% in November. In sum, although measures of unemployment remain at unacceptable levels, the January readings point to improving labor market conditions.
Details of the establishment survey indicate that firms have not raised their payrolls at a robust pace in January. Overall payrolls increased 36,000 and private hiring increased 50,000 in January, which is disappointing given that the economy has registered 19 months of growth. The BLS published benchmark revisions from April 2009 in today's report. As a result of the benchmark revisions, total payroll employment increased 909,000 in 2010, which is 215,000 lower than the prior estimate and private sector payrolls increased 1.145 million in 2010 vs. a gain of 1.346 million before revisions.
In January, bad weather contributed to a reduction in construction employment but factory hiring increased and overall service sector employment rose only 18,000. The highlights of changes in payroll employment in January 2011 are listed below.
Highlights of changes in payrolls during January 2011:
Construction: -32,000 vs. -17,000 in December
Manufacturing: +49,000 vs. +14,000 in December
Private sector service employment: +32,000 vs. +146,000 in December
Retail employment: +28,000 vs. +3,000 in December
Professional and business services: +31,000 vs. +54,000 in December
Temporary help: -11,400 vs. +38,100 in December
Financial activities: -10,000 vs. no change in December
Health care employment: +10,600 vs. +26,700 in December
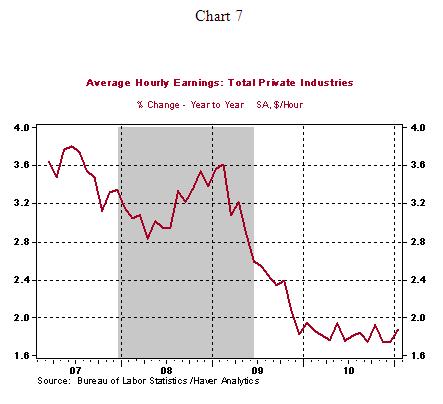
In January, hourly earnings increased 0.4% to $22.86, a noticeable jump but not problematic as it yields a year-to-year gain of only 1.9%. In addition, the high level of unemployment indicates that it is by no means a signal of future wage inflation. The mild growth in payroll employment and the strong increase in hourly earnings points to a more-than-moderate increase in personal income during January. The steady manufacturing man-hours index suggests an unchanged reading of factory production in January.
Asha Bangalore — Senior Vice President and Economist
http://www.northerntrust.com
Asha Bangalore is Vice President and Economist at The Northern Trust Company, Chicago. Prior to joining the bank in 1994, she was Consultant to savings and loan institutions and commercial banks at Financial & Economic Strategies Corporation, Chicago.
Copyright © 2011 Asha Bangalore
The opinions expressed herein are those of the author and do not necessarily represent the views of The Northern Trust Company. The Northern Trust Company does not warrant the accuracy or completeness of information contained herein, such information is subject to change and is not intended to influence your investment decisions.
© 2005-2022 http://www.MarketOracle.co.uk - The Market Oracle is a FREE Daily Financial Markets Analysis & Forecasting online publication.