


Stock Market Correction is Nearly Over
Stock-Markets / Stock Markets 2011 Mar 20, 2011 - 04:42 AM GMTBy: Tony_Caldaro

 Markets, worldwide, had some serious declines early in the week but rebounded by week’s end to lessen the losses for the week. Japan’s Nikkei had nearly a 20% decline in two days but recovered to end the week -10.2%. In the US the SPX/DOW were -1.7%, and the NDX/NAZ were -3.1%. Asian markets overall were -3.4%, Europe markets -2.9%, the DJ World index was -2.0%, but the Commodity equity group was +0.9%.
US economic reports continue to come in positive. The NY/Philly FED, capacity utilization, the monetary base, the WLEI and BEA leading indicators rose; import/export prices remained positive along with the PPI/CPI; the NAHB was marginally positive, and the weekly jobless claims declined. On the negative side, housing starts, building permits, industrial production and the M1-multiplier all declined, while the currenty accounts deficit remained largely negative. Next week will be highlighted by home sales, durable goods and the Q4 GDP final. Best to your week!
LONG TERM: bull market
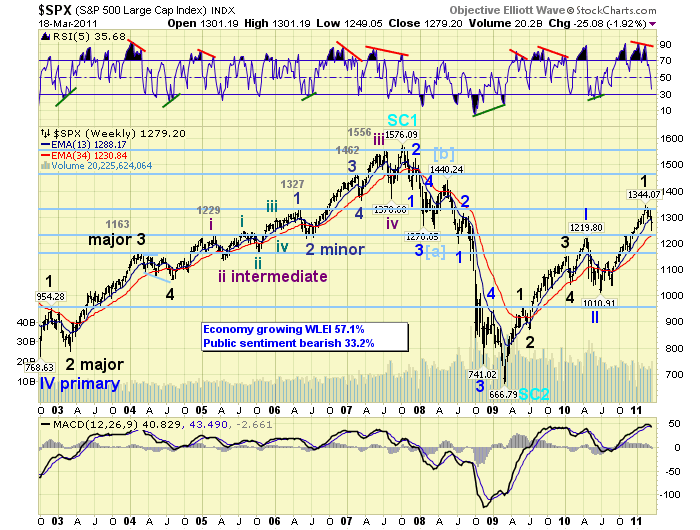
Anyone that can read Elliott Wave labeling can clearly see that this is, and has been, a bull market since March 2009. They can also see that we had a five wave bull market between Oct02 and Oct07, and then a three wave bear market between Oct07 and Mar09. OEW quantified every wave and we have labeled them as they have unfolded. Any other counts are simply subjective. Our RSI/MACD indicators continue to display bull market characteristics: mostly overbought and above neutral respectively. This bull market continues to reach similar level achieved during the last bull market, only faster. And, the economy continues to grow as noted by the WLEI at 57.1%: above neutral (50%) is economic growth. This is not a bear market rally.
MEDIUM TERM: downtrend
After a seven month Major wave 1 uptrend, (July10-Feb11), when the SPX rose 333 points or 32.9%, the market finally entered a downtrend and Major wave 2. The downtrend started over the President’s day holiday weekend, when Libya started firing on government protestors and Crude oil spiked over $10/bbl in two days. That was four weeks ago. After a few weeks of generally sideways market activity, an earthquake in Japan and the tsunami that followed sent the equity markets reeling this week.
Despite the two economic shocks and the four week correction the SPX has only declined from 1344 – 1249, or 7.1%. This decline is less than any of the previous corrections during this bull market; i.e. 9.1%, 9.1% and 17.1% respectively. But, nearly longer in time than the first two. In short, we would have expected a bit more price damage at this point in time.
When we review fibonacci retracements for the recent uptrend we find SPX 1217 = 38.2% Major 1, and SPX 1177 = 50% Major 1. Next we review the short term count within the downtrend. With 1344-1294 = Int. A, and 1332 = Int. B; at SPX 1252 C = 1.62 A, SPX 1232 C = 2.0 A, and at SPX 1202 C = 2.62 A. Finally we review the OEW support pivots: 1240, 1222 and 1187. Since the SPX has already reached 1249 we have omitted most of the higher price relationships. The SPX 1177 (50%), 1187 pivot and 1202 (2.62 A) appear to be a worse case scenario. The SPX 1217 (38.2%), 1222 pivot and 9.1% correction appear to be the obvious scenario. The SPX 1252 (1.62 A), the SPX 1232 (2.0 A) and 1240 pivot appear to be the minimum scenario for a downtrend low.
When we review the RSI/MACD activity on the various timeframes. We find that the market has already reached some important oversold levels. Naturally the market can get more oversold over time. For now, however, the prudent thing would be to start looking for a low for this uptrend starting around the 1240 pivot range.
SHORT TERM
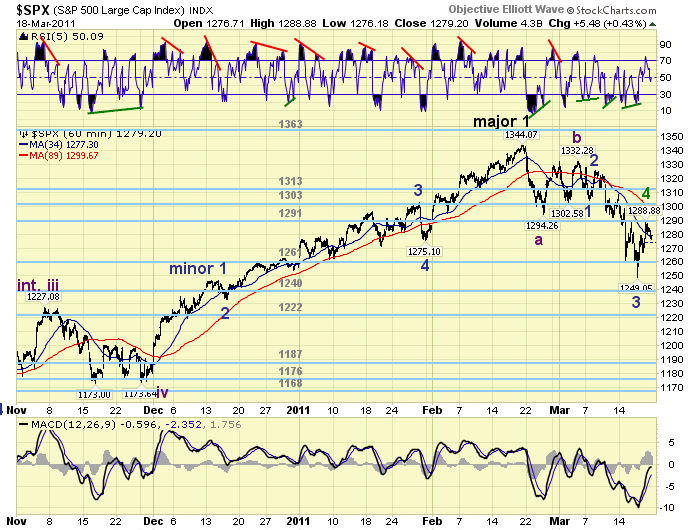
Support for the SPX remains at 1261 and then 1240, with resistance at 1291 and then 1303. Short term momentum hit overbought friday, for the first time in over a week, then ended at neutral. The short term wave count suggests the SPX just completed Minor wave 4 of Intermediate C at 1289. We should now get a decline to new downtrend lows to complete Minor 5, Intermediate C and Major 2. Let’s start looking for a low at the OEW 1240 pivot. Best to your trading!
FOREIGN MARKETS
Asian markets were all lower on the week for a net loss of 3.4%. All indices are downtrending except China’s SSEC.
European markets were all lower as well for a net loss of 2.9%. All indices are in downtrends.
The Commodity equity group were all higher on the week for a net gain of 0.9%. Russia’s RTSI and Brazil’s BVSP remain in uptrends.
The DJ World index is downtrending and lost 2.0% on the week.
COMMODITIES
Bond prices (+0.8%) have been uptrending and Bond yields downtrending. The 1 YR rate equalled its lowest level in history this week at 0.21%. The FED is right where it should be.
Uptrending Crude had a volatile week, about a $7.50 swing, and gained 0.3% on the week.
Gold pulled back early in the week and then rallied, gaining 0.1%. Gold/Silver uptrending.
The downtrending USD made new lows for the year this week: -1.5%. The fiat currency debasing continues.
NEXT WEEK
Quieter week ahead. Monday at 10:00 Existing home sales. Tuesday we have the FHFA home price index. Then on wednesday New home sales. On thursday weekly Jobless claims and Durable goods orders. On friday Q4 GDP and then Consumer sentiment. As for the FED. On wednesday FED chairman Bernanke gives a speech in San Diego. Then on thursday, FED governor Duke gives a speech in Richmond. Best to your week!
CHARTS: http://stockcharts.com/def/servlet/Favorites.CServlet?obj=ID1606987
http://caldaroew.spaces.live.com
After about 40 years of investing in the markets one learns that the markets are constantly changing, not only in price, but in what drives the markets. In the 1960s, the Nifty Fifty were the leaders of the stock market. In the 1970s, stock selection using Technical Analysis was important, as the market stayed with a trading range for the entire decade. In the 1980s, the market finally broke out of it doldrums, as the DOW broke through 1100 in 1982, and launched the greatest bull market on record.
Sharing is an important aspect of a life. Over 100 people have joined our group, from all walks of life, covering twenty three countries across the globe. It's been the most fun I have ever had in the market. Sharing uncommon knowledge, with investors. In hope of aiding them in finding their financial independence.
Copyright © 2011 Tony Caldaro - All Rights Reserved Disclaimer: The above is a matter of opinion provided for general information purposes only and is not intended as investment advice. Information and analysis above are derived from sources and utilising methods believed to be reliable, but we cannot accept responsibility for any losses you may incur as a result of this analysis. Individuals should consult with their personal financial advisors.
© 2005-2022 http://www.MarketOracle.co.uk - The Market Oracle is a FREE Daily Financial Markets Analysis & Forecasting online publication.