


Crude Oil vs. Natural Gas, Which One is Wrong?
Commodities / Crude Oil Jun 09, 2011 - 06:41 AM GMTBy: Willem_Weytjens

 When we have a look at Oil prices and Natural Gas Prices, we can see that both prices were highly correlated since at least 1994 until early 2009 (with 1 exception in 2001):
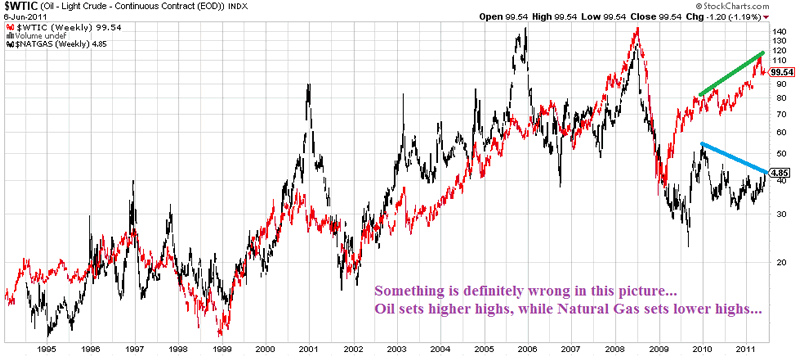
Chart courtesy stockcharts.com
However, the correlation broke down early 2009, when Oil started to rise, while Natural Gas remained very weak.
Oil set higher highs in 2010-2011, while Natural Gas set lower highs.
Since the correlation seems to be so high, we should see a relatively stable ratio over time, which is true:
We have a relatively stable ratio going from roughly 4 to 14, which means Oil has been trading at 4 to 14 times Natural gas prices. When the correlation broke down in 2009, this ratio shot higher to as high as 28.
The ratio is declining the last couple of weeks, but is still far above the trading range.
The long term average is around 8, while the ratio is now at 20.5, meaning Oil is too expensive relative to Natural Gas (if history is any guide).
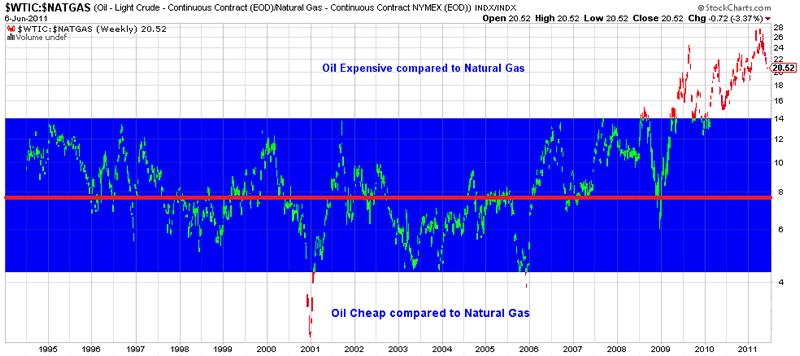
Chart courtesy stockcharts.com
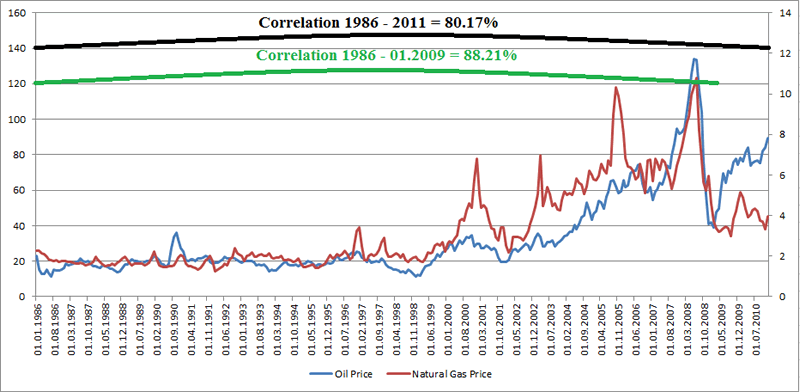
Unfortunately, the data of Stockcharts goes back to only 1994, so I looked for more data, and found data going back to 1986 at the US Energy Information Administration. (www.eia.gov)
I made some calculations in Excel, and found out that the correlation from 1986 to January 2009 between Oil and Natural Gas ws as high as 88.71%.
This is a longer term view of the monthly ratio:
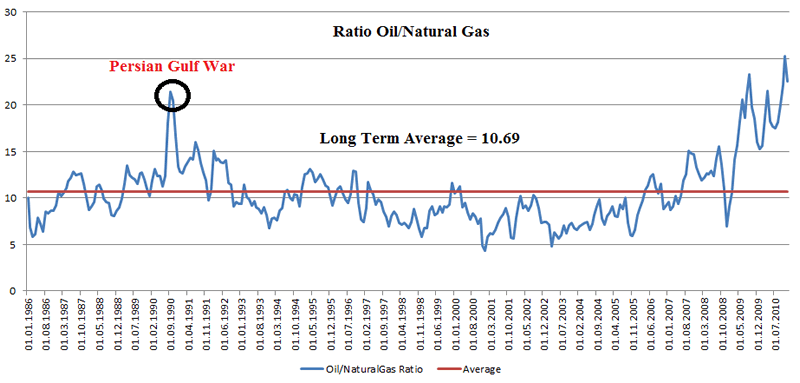
We can see that the ratio is currently even higher than in 1990 during the Persian Gulf War. The historical monthly average from 1986 to today is 10.69, shown by the red line.
Supply of Natural Gas has increased due to new, cheaper technologies. When supply increases and demand remains the same, prices fall.
Oil prices have risen the last couple of years because people think the era of cheap oil is over. Costs of extracting oil increase because it becomes harder to find big oil fields, which limits supply. The Crisis in the Middle East and the surge in inflation have also helped Oil surge.
However, if the price of Oil would rise a lot, we can expect the demand to shift from Oil to the less expensive gas.Less demand for Oil and more demand for Gaswould likely reduce the price of oil and increase the price of Gas. The market should go back to an equilibrium point over the long run.
To see the Excel sheet used for these calculations and charts, please click Here…
Willem Weytjens
www.profitimes.com
© 2011 Copyright Willem Weytjens - All Rights Reserved
Disclaimer: The above is a matter of opinion provided for general information purposes only and is not intended as investment advice. Information and analysis above are derived from sources and utilising methods believed to be reliable, but we cannot accept responsibility for any losses you may incur as a result of this analysis. Individuals should consult with their personal financial advisors.
© 2005-2022 http://www.MarketOracle.co.uk - The Market Oracle is a FREE Daily Financial Markets Analysis & Forecasting online publication.