Most Popular
1. It’s a New Macro, the Gold Market Knows It, But Dead Men Walking Do Not (yet)- Gary_Tanashian
2.Stock Market Presidential Election Cycle Seasonal Trend Analysis - Nadeem_Walayat
3. Bitcoin S&P Pattern - Nadeem_Walayat
4.Nvidia Blow Off Top - Flying High like the Phoenix too Close to the Sun - Nadeem_Walayat
4.U.S. financial market’s “Weimar phase” impact to your fiat and digital assets - Raymond_Matison
5. How to Profit from the Global Warming ClImate Change Mega Death Trend - Part1 - Nadeem_Walayat
7.Bitcoin Gravy Train Trend Forecast 2024 - - Nadeem_Walayat
8.The Bond Trade and Interest Rates - Nadeem_Walayat
9.It’s Easy to Scream Stocks Bubble! - Stephen_McBride
10.Fed’s Next Intertest Rate Move might not align with popular consensus - Richard_Mills
Last 7 days
US House Prices Trend Forecast 2024 to 2026 - 11th Oct 24
US Housing Market Analysis - Immigration Drives House Prices Higher - 30th Sep 24
Stock Market October Correction - 30th Sep 24
The Folly of Tariffs and Trade Wars - 30th Sep 24
Gold: 5 principles to help you stay ahead of price turns - 30th Sep 24
The Everything Rally will Spark multi year Bull Market - 30th Sep 24
US FIXED MORTGAGES LIMITING SUPPLY - 23rd Sep 24
US Housing Market Free Equity - 23rd Sep 24
US Rate Cut FOMO In Stock Market Correction Window - 22nd Sep 24
US State Demographics - 22nd Sep 24
Gold and Silver Shine as the Fed Cuts Rates: What’s Next? - 22nd Sep 24
Stock Market Sentiment Speaks:Nothing Can Topple This Market - 22nd Sep 24
US Population Growth Rate - 17th Sep 24
Are Stocks Overheating? - 17th Sep 24
Sentiment Speaks: Silver Is At A Major Turning Point - 17th Sep 24
If The Stock Market Turn Quickly, How Bad Can Things Get? - 17th Sep 24
IMMIGRATION DRIVES HOUSE PRICES HIGHER - 12th Sep 24
Global Debt Bubble - 12th Sep 24
Gold’s Outlook CPI Data - 12th Sep 24
RECESSION When Yield Curve Uninverts - 8th Sep 24
Sentiment Speaks: Silver Is Set Up To Shine - 8th Sep 24
Precious Metals Shine in August: Gold and Silver Surge Ahead - 8th Sep 24
Gold’s Demand Comeback - 8th Sep 24
Gold’s Quick Reversal and Copper’s Major Indications - 8th Sep 24
GLOBAL WARMING Housing Market Consequences Right Now - 6th Sep 24
Crude Oil’s Sign for Gold Investors - 6th Sep 24
Stocks Face Uncertainty Following Sell-Off- 6th Sep 24
GOLD WILL CONTINUE TO OUTPERFORM MINING SHARES - 6th Sep 24
AI Stocks Portfolio and Bitcoin September 2024 - 3rd Sep 24
2024 = 1984 - AI Equals Loss of Agency - 30th Aug 24
UBI - Universal Billionaire Income - 30th Aug 24
US COUNTING DOWN TO CRISIS, CATASTROPHE AND COLLAPSE - 30th Aug 24
GBP/USD Uptrend: What’s Next for the Pair? - 30th Aug 24
The Post-2020 History of the 10-2 US Treasury Yield Curve - 30th Aug 24
Stocks Likely to Extend Consolidation: Topping Pattern Forming? - 30th Aug 24
Why Stock-Market Success Is Usually Only Temporary - 30th Aug 24
The Consequences of AI - 24th Aug 24
Can Greedy Politicians Really Stop Price Inflation With a "Price Gouging" Ban? - 24th Aug 24
Why Alien Intelligence Cannot Predict the Future - 23rd Aug 24
Stock Market Surefire Way to Go Broke - 23rd Aug 24
RIP Google Search - 23rd Aug 24
What happened to the Fed’s Gold? - 23rd Aug 24
US Dollar Reserves Have Dropped By 14 Percent Since 2002 - 23rd Aug 24
Will Electric Vehicles Be the Killer App for Silver? - 23rd Aug 24
EUR/USD Update: Strong Uptrend and Key Levels to Watch - 23rd Aug 24
Gold Mid-Tier Mining Stocks Fundamentals - 23rd Aug 24
My GCSE Exam Results Day Shock! 2024 - 23rd Aug 24

Market Oracle FREE Newsletter

How to Protect your Wealth by Investing in AI Tech Stocks

The Misery Index vs SP500 and Gold

Stock-Markets / Financial Markets 2011 Jun 23, 2011 - 06:47 AM GMT

By: Willem_Weytjens

Stock-Markets

Best Financial Markets Analysis ArticleThe Misery Index, the sum of the inflation rate and the unemployment rate reaches a multi-decade high. The index was created in 1976 by Jimmy Carter’s economists in an attack on Gerald Ford, but it backfired when it spiked under Carter.


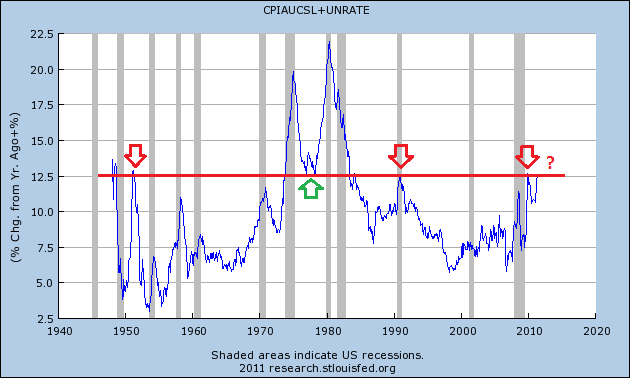
Chart from stlouisfed.org

From the chart above, we can see that the current level has acted as both support and resistance in the past. Will it act as resistance this time as well?

I did some research, downloaded the data in excel, I downloaded data of the SP500 at Yahoo Finance, created some charts using these data and I made some interesting observations.

First of all, for those of you who would like to have the excel sheet, please click HERE

Now let’s look at the observations:

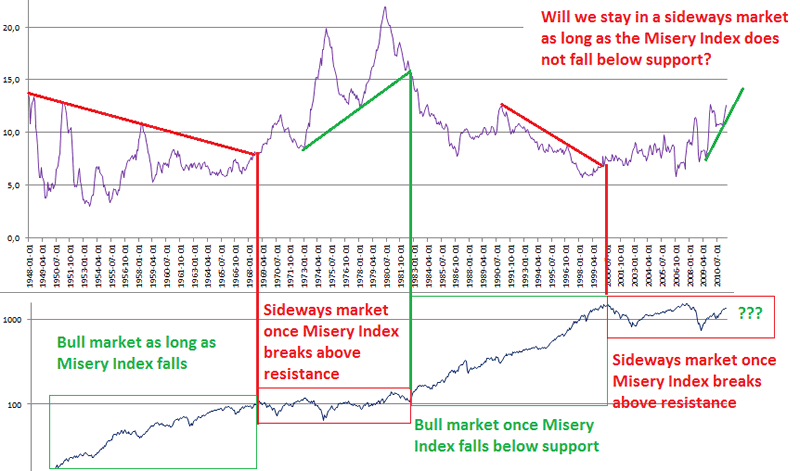
When the Misery index was falling, this meant higher stock prices. Once the multi-year resistance line was broken in 1968, the bull market ended, and a sideways market followed (for years) until the Misery index fell below its multi-year support line in 1982, the market bottomed and a huge bull market followed.

Then again in 2000, the Misery index broke above its multi-year resistance line, and stocks have been trading sideways ever since. Or sideways that is…

(I mean visually, on a log-scale chart).

So what can we conclude? The Misery index is still rising, and as long as the multi-year support line does not break, we should expect to remain in a sideways trend for years to come…

PS, it’s also good to know Gold started a bull market in the early ’70s that ended in 1980, and started a new bull market in the early ’2000s…

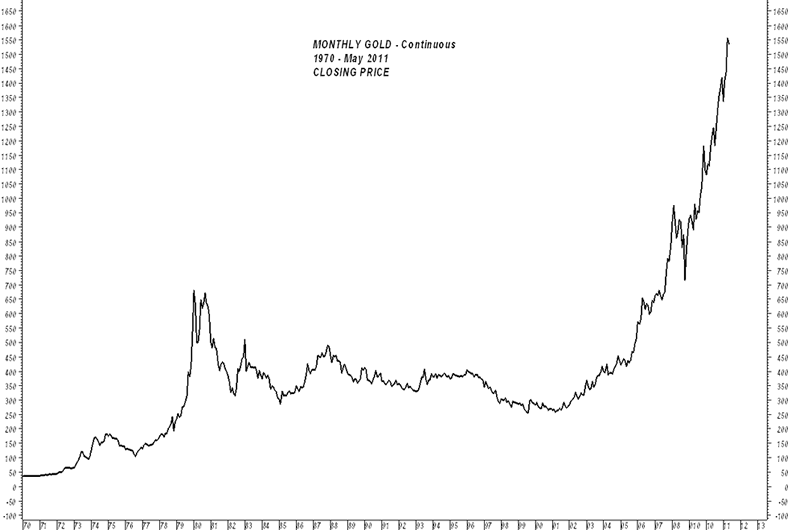
Chart from JSMineset.com

Willem Weytjens
www.profitimes.com

© 2011 Copyright Willem Weytjens - All Rights Reserved

Disclaimer: The above is a matter of opinion provided for general information purposes only and is not intended as investment advice. Information and analysis above are derived from sources and utilising methods believed to be reliable, but we cannot accept responsibility for any losses you may incur as a result of this analysis. Individuals should consult with their personal financial advisors.


© 2005-2022 http://www.MarketOracle.co.uk - The Market Oracle is a FREE Daily Financial Markets Analysis & Forecasting online publication.


Post Comment

Only logged in users are allowed to post comments. Register/ Log in