


Stock Market Gone Nowhere, Gold and Silver in Synch
Stock-Markets / Financial Markets 2011 Jun 26, 2011 - 12:26 PM GMT

 Last weeks ideas still stand as we essentially went nowhere over the past week, just a bunch of noise that was chopping up traders, but also left the market venerable to more downside, we were actually bullish going into the lows made last week, as I wanted to see a big reaction of the 200DMA test, as the triangle option was a setup we were following, if the market made a low, we could see a big push higher. Well we got the big push off the lows I was expecting, but the lack of follow through was the disappointment and once we broke under our keys support areas on a pullback, we knew once again we needed to get short and start looking for new lows, of course we got some wild swings from the Greece news, and I felt without that news the market was heading lower.
The bounce of the Greece news was short lived, and our key 1280SPX area once again proved to be useful as we were sellers underneath and buyers above, I had my doubts about follow through from the initial ramp off the Greece news, simply because it was artificial in that it was forced buying, and the lack of follow through proved to be the case, as the market grinded lower. The key area of 1280SPX continues to be the short term bull/bear line that we are using, as long as its below that area, it's a sell.
SPX
So what is likely going on now? The market spent most of the time last week in a range and chopped up traders, when we see price action like that, its classic of a 4th wave, potentially a triangle or flat pattern.
So with that in mind, the idea of a 4th wave of smaller degree from the highs at 1270SPX started to make sense, late last week, and staying under 1280SPX keeps the trend lower and potentially seeing under 1248SPX from here to complete a 5 wave decline as well as a larger expanded flat pattern.
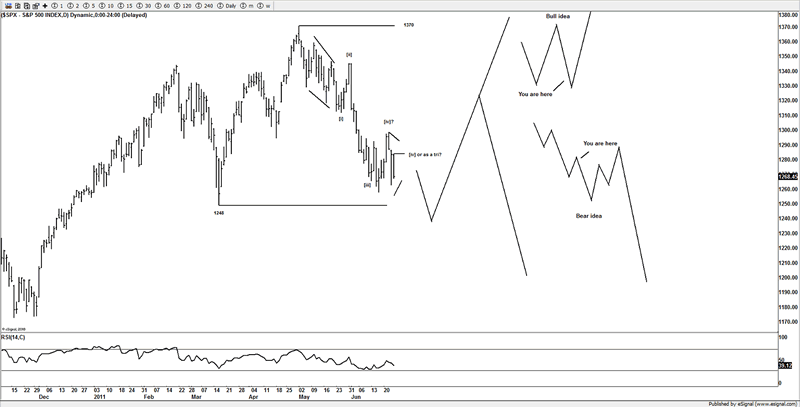
So the bottom line is that as long as under 1280SPX look lower, but we suspect that we are still trying to finish the decline from the 1370SPX high made in May 2011.
Looking at the NYSE MC Osc, you can see that we had a small divergence on that last low, and if we see price push lower again, to produce a 5th wave low, I suspect we will see a divergence again, as price pushes lower, we hold up on the MC Osc and fail to push lower than the prior low, thus creating a divergence, which is what I would expect to see, as many look to sell the lows, the internals could be suggesting the end to the trend and the end of a 5 wave sequence.
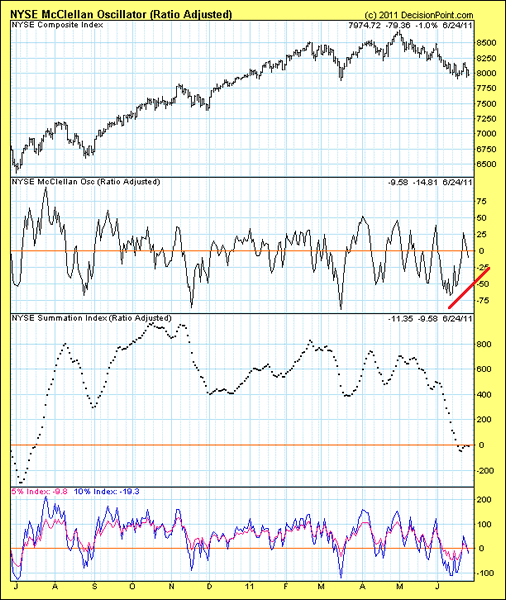
So we may need to probe a bit lower, if something more bearish is talking shape, I would expect to see the internals really gain traction and push lower, thus so far that's not the case, the actual internals are suggesting, that the market is still trying to carve a low.
Many eyes are glued to the 200DMA, and I actually like the idea of pushing under that area, to hit sell stops that will likely to be building up on that area from the early buyers, and then reverse once we put in a 5th wave, however, if we were to see a strong move that pushes above 1280SPX then 1300SPX we would have to consider other options, but getting above 1280SPX is the 1st clue for the bears to be cautious off.
The bullish idea on the SPX and many of the other US markets is that they are working an expanded flat and in wave [c] of that move and in a small degree 4th wave, and head lower in a 5th wave, thus completing a correction and then reverse and head far higher. The DAX and FTSE continue to hold key support as discussed in last week's article, so both those markets have essentially gone nowhere like the US markets, other than chop around, as long as key support hold on the markets, I am still open to the idea of seeing new yearly highs.
That may sound a crazy idea atm, but until the markets break the patterns that can see potential new yearly highs from here, I will not throw those ideas away because of a bias to the downside, I have gone it alone before, and as long as price continue to support the ideas I am working with, then I am keep those options on the table.
If price shows me evidence here of a more bearish downside idea, then sure, I will adjust and get aggressive short like most traders should, if price suggests that, but right now, we have not gone anywhere for the last week or so, and my key support areas are still valid and yet to be violated and as long as they hold, we need to respect the upside potential here, and the potential to be carving a low at these levels.
The bearish idea is that we put in a 5 wave decline, then only see a brief correction, and potentially see a H&S setup so any bounce that tops around the 1320-1340SPX area would be a right shoulder. But that's for later, right now I am focuses on staying above or below 1280SPX and what happens as we probe lower.
Silver
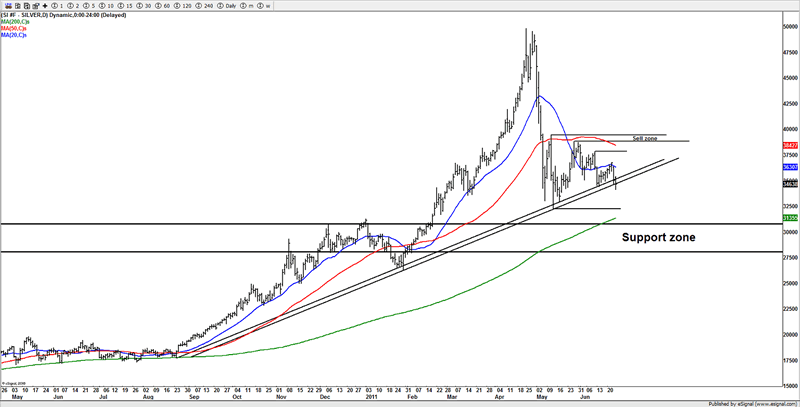
In the midst of the chop we saw in the equity markets, we managed to stay on top of the setup we were looking for last week, we were watching the $36.50 area for a rejection from the 20DMA, and we got exactly that, and just held the support trend lines, with decent structure, the potential is for a hard sustained break now and seeing the support zone around the $30 area from here, as long as last week's high remains in place, then potentially now to see a break of the trend lines and the $30 area.
Gold
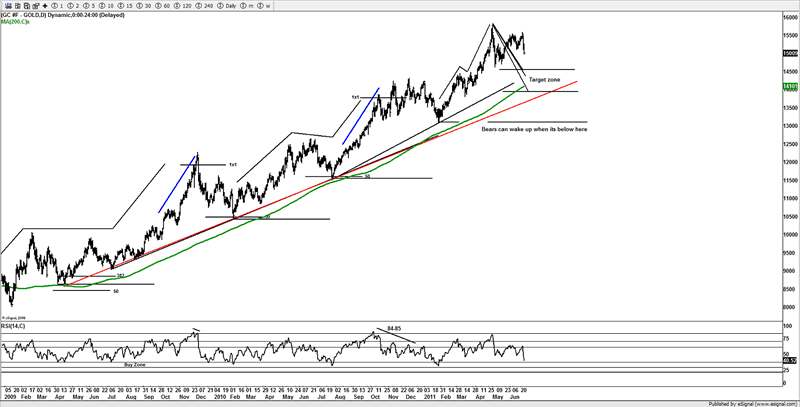
Gold and silver followed each other the past week and were virtually in sync, but I suspect this is still a correction in an ongoing bull market trend, with a target band just below, the targets are based off the previous fractals from the corrections, and the 200DMA sits underneath, as well as long term support from a long term trend line.
Looking at the RSI, I suspect seeing that reach the "buy zone" will see price reach the target zone, only a move under the $1400 would I then start to look at bearish options.
Conclusion
Overall I still suspect at this juncture that the US and European markets are still trying to carve out a low at these levels, nothing really changed much from last week's ideas and here is a good time to focus on the larger ideas, as short term price action that whips around like we saw over the past week, can defuse ideas. Under 1280SPX continues to keep the trend down short term.
I have a few other ideas in some markets, that we are following early next week, one of them is corn, as I think it could be a real winner over the coming weeks, as the potential that its marked a long term high, is looking far more likely as price pushes lower, so in the midst of chop land, there is still a few markets, that we are going to turn to as the equity markets continue to chop around.
Until next time.
Have a profitable week ahead.
Click here to become a member
You can also follow us on twitter
What do we offer?
Short and long term analysis on US and European markets, various major FX pairs, commodities from Gold and silver to markets like natural gas.
Daily analysis on where I think the market is going with key support and resistance areas, we move and adjust as the market adjusts.
A chat room where members can discuss ideas with me or other members.
Members get to know who is moving the markets in the S&P pits*
*I have permission to post comments from the audio I hear from the S&P pits.
If you looking for quality analysis from someone that actually looks at multiple charts and works hard at providing members information to stay on the right side of the trends and making $$$, why not give the site a trial.
If any of the readers want to see this article in a PDF format.
Please send an e-mail to Enquires@wavepatterntraders.com
Please put in the header PDF, or make it known that you want to be added to the mailing list for any future articles.
Or if you have any questions about becoming a member, please use the email address above.
If you like what you see, or want to see more of my work, then please sign up for the 4 week trial.
This article is just a small portion of the markets I follow.
I cover many markets, from FX to US equities, right the way through to commodities.
If I have the data I am more than willing to offer requests to members.
Currently new members can sign up for a 4 week free trial to test drive the site, and see if my work can help in your trading and if it meets your requirements.
If you don't like what you see, then drop me an email within the 1st 4 weeks from when you join, and ask for a no questions refund.
You simply have nothing to lose.
By Jason Soni AKA Nouf
© 2011 Copyright Jason Soni AKA Nouf - All Rights Reserved
Disclaimer: The above is a matter of opinion provided for general information purposes only and is not intended as investment advice. Information and analysis above are derived from sources and utilising methods believed to be reliable, but we cannot accept responsibility for any losses you may incur as a result of this analysis. Individuals should consult with their personal financial advisors.
© 2005-2022 http://www.MarketOracle.co.uk - The Market Oracle is a FREE Daily Financial Markets Analysis & Forecasting online publication.