Most Popular
1. It’s a New Macro, the Gold Market Knows It, But Dead Men Walking Do Not (yet)- Gary_Tanashian
2.Stock Market Presidential Election Cycle Seasonal Trend Analysis - Nadeem_Walayat
3. Bitcoin S&P Pattern - Nadeem_Walayat
4.Nvidia Blow Off Top - Flying High like the Phoenix too Close to the Sun - Nadeem_Walayat
4.U.S. financial market’s “Weimar phase” impact to your fiat and digital assets - Raymond_Matison
5. How to Profit from the Global Warming ClImate Change Mega Death Trend - Part1 - Nadeem_Walayat
7.Bitcoin Gravy Train Trend Forecast 2024 - - Nadeem_Walayat
8.The Bond Trade and Interest Rates - Nadeem_Walayat
9.It’s Easy to Scream Stocks Bubble! - Stephen_McBride
10.Fed’s Next Intertest Rate Move might not align with popular consensus - Richard_Mills
Last 7 days
All Measures to Combat Global Warming Are Smoke and Mirrors! - 18th Apr 24
Cisco Then vs. Nvidia Now - 18th Apr 24
Is the Biden Administration Trying To Destroy the Dollar? - 18th Apr 24
S&P Stock Market Trend Forecast to Dec 2024 - 16th Apr 24
No Deposit Bonuses: Boost Your Finances - 16th Apr 24
Global Warming ClImate Change Mega Death Trend - 8th Apr 24
Gold Is Rallying Again, But Silver Could Get REALLY Interesting - 8th Apr 24
Media Elite Belittle Inflation Struggles of Ordinary Americans - 8th Apr 24
Profit from the Roaring AI 2020's Tech Stocks Economic Boom - 8th Apr 24
Stock Market Election Year Five Nights at Freddy's - 7th Apr 24
It’s a New Macro, the Gold Market Knows It, But Dead Men Walking Do Not (yet)- 7th Apr 24
AI Revolution and NVDA: Why Tough Going May Be Ahead - 7th Apr 24
Hidden cost of US homeownership just saw its biggest spike in 5 years - 7th Apr 24
What Happens To Gold Price If The Fed Doesn’t Cut Rates? - 7th Apr 24
The Fed is becoming increasingly divided on interest rates - 7th Apr 24
The Evils of Paper Money Have no End - 7th Apr 24
Stock Market Presidential Election Cycle Seasonal Trend Analysis - 3rd Apr 24
Stock Market Presidential Election Cycle Seasonal Trend - 2nd Apr 24
Dow Stock Market Annual Percent Change Analysis 2024 - 2nd Apr 24
Bitcoin S&P Pattern - 31st Mar 24
S&P Stock Market Correlating Seasonal Swings - 31st Mar 24
S&P SEASONAL ANALYSIS - 31st Mar 24
Here's a Dirty Little Secret: Federal Reserve Monetary Policy Is Still Loose - 31st Mar 24
Tandem Chairman Paul Pester on Fintech, AI, and the Future of Banking in the UK - 31st Mar 24
Stock Market Volatility (VIX) - 25th Mar 24
Stock Market Investor Sentiment - 25th Mar 24
The Federal Reserve Didn't Do Anything But It Had Plenty to Say - 25th Mar 24

Market Oracle FREE Newsletter

How to Protect your Wealth by Investing in AI Tech Stocks

Coming in October: Next Major Stock Market Cycle Low

Stock-Markets / Stock Markets 2011 Aug 17, 2011 - 06:03 AM GMT

By: Mike_Paulenoff

Stock-Markets

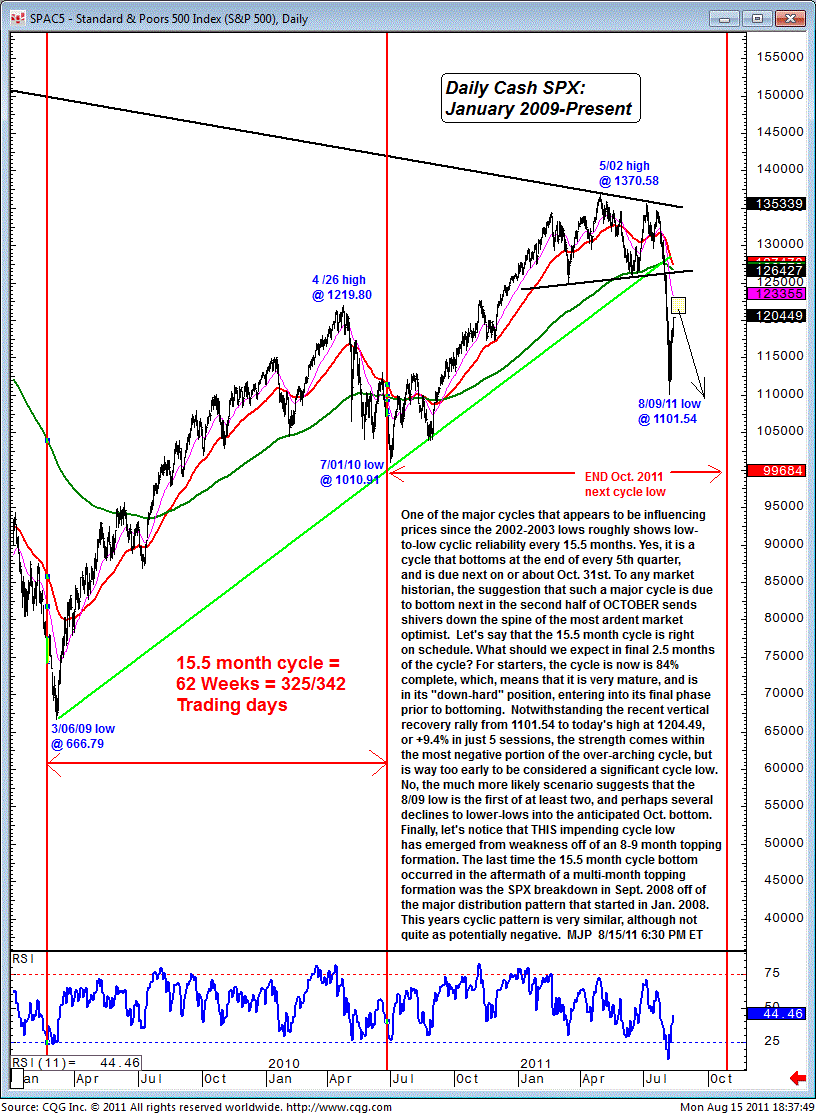
A major price cycle on the daily S&P 500 chart, which shows reliability in bottoming about every 15.5 months, is due for its next low on or about October 31.  The cycle appears to have been influencing prices since the 2002-03 lows.

To any market historian, the suggestion that such a major cycle is due to bottom next in the second half of October sends shivers down the spine of the most ardent market optimist.


The cycle is now 84% complete, which means that it is very mature and is in its "down-hard" position entering into its final phase prior to bottoming.  Notwithstanding the recent vertical recovery rally from 1101.54 to today's high at 1204.49, or +9.4% in just five sessions, the strength comes within the most negative portion of the overarching cycle, but is way too early to be considered a significant cycle low.

No, the much more likely scenario suggests that the Aug 9 low is the first of at least two, and perhaps several, declines to lower-lows into the anticipated October bottom.

Finally, let's notice that this impending cycle low has emerged from weakness off of an 8-9 month topping formation.  The last time the 15.5 month cycle bottom occurred in the aftermath of a multi-month topping formation was the SPX breakdown in September 2008 off of a major distribution pattern that started in January 2008.

This year's cyclic pattern is very similar, although not quite as potentially negative.

Sign up for a free 15-day trial to Mike's ETF & Stock Trading Diary today.

By Mike Paulenoff

Mike Paulenoff is author of MPTrader.com (www.mptrader.com), a real-time diary of his technical analysis and trading alerts on ETFs covering metals, energy, equity indices, currencies, Treasuries, and specific industries and international regions.

© 2002-2011 MPTrader.com, an AdviceTrade publication.  All rights reserved. Any publication, distribution, retransmission or reproduction of information or data contained on this Web site without written consent from MPTrader is prohibited. See our disclaimer.

Mike Paulenoff Archive

© 2005-2022 http://www.MarketOracle.co.uk - The Market Oracle is a FREE Daily Financial Markets Analysis & Forecasting online publication.


Post Comment

Only logged in users are allowed to post comments. Register/ Log in