


Stock Market at The Point of No Return
Stock-Markets / Stock Markets 2011 Oct 16, 2011 - 06:49 AM GMT

 Impressive is a understated word, but I don't think many would have expected in just 9 days to see a rally of near 150 points in the SPX in such a short space of time.
The bears simply never stood a chance as the market took "risk on" to a new level. In arguably a move that will likely go down in history as one of the quickest 9 days rallies in history, I have not checked on the stats, but in recent times for a 9 day move, that's the quickest move I can recall.
The higher it went the more you simply had to stand back and admire it, as the risk for a reversal to correct the move got ever increasingly more dangerous.
Seeing a near 150 point move in such a short space of time, signals a market that has likely squeezed out virtually all the shorts in this market, which makes this move we have seen over the past 2 weeks ever more critical of finding real buyers now. With the short interest likely collapsed as having been squeezed out of the market, the market is at a real critical point where actual solid buyers with weight and firepower need to take up the slack on any corrective pullback or move lower, or I think the market is going to run into some issues fast.
Back in the fall of 2008 when the US government decided to ban shorting financial stocks and force the shorts to cover, so it kicked in a short squeeze of huge ramifications, what they actually did was cause the crash.
You see when the market forces a short squeeze, it forces the shorts to cover positions, and hence you see the market climb higher and such a fast pace and the market feeds on itself, only when the buyers stop and the shorts are out, the buyers that are left don't really have the fire power to sustain the move, hence you get the equally aggressive reversal after.
By forcing the shorts now to cover positions, it has in effect potentially setup a huge problem, as if the buyers and by that I mean real buyers with fire power don't step up and take up the slack once the shorts have stops covering. Then you potentially have a situation of "no bid".
What that essentially means is, if the market can't be supported and enough buyers don't stop the stem of any natural sellers, you could have a fast and furious move lower setting up, and without the short sellers to cover shorts, you won't see much in the way of bounces.
You saw that back in August of this year, once the bears had finally capitulated the bulls could not hold and sustain the move lower so the market had a "no bid" and the floor fell out of the market.
If that is again setting up here, the market is going to be in trouble fast and you don't have much in the way of any bears to cover short trades, as the past 2 weeks has all but killed any that were likely stubborn and held on from last week thinking a dip would be seen.
I think most traders would have expected a normal correction last week; I personally was looking for such a move, but it never came, the market simply virtually doubled from an overbought situation to a situation that put this rally into the record books as one of the most aggressive rallies in recent times.
So it now comes down to a point of no return.
SPX
Last week I was expecting a correction and looking to finding opportunities to get long on a dip, however the market had other ideas, something far far bullish than I had imagined, in fact I think the market pulled the wool over most traders and investors, but continuing to push higher and literally a non stop 2 week rally.
You how have to take one look at markets in Europe to see that pullbacks were pretty nonexistent, this was a clear cut case of the "train leaving the station without any passengers" or few if any.
Even as earlier as Monday, I sensed the market was setting up something far more bullish than I had anticipated, and chances of getting long were fast slipping by as the higher it went the more risky it became as dips were few and far between. We managed to get in and buy dips a couple of times but took the money off the table thinking a better dip would come, but it still never came, and it continued higher and I had to start looking for obvious reasons as to why the market was rallying with so much strength.
Looking around, I saw little evidence in our risk FX pairs, so that was a clue that we struggled with, and the way the market was behaving was something aggressive.
So going back to basics, looking and what price was doing, had the look and feel of an impulsive move and looking around, I started to see some of the pieces fit together as to why the market was rallying as it did.
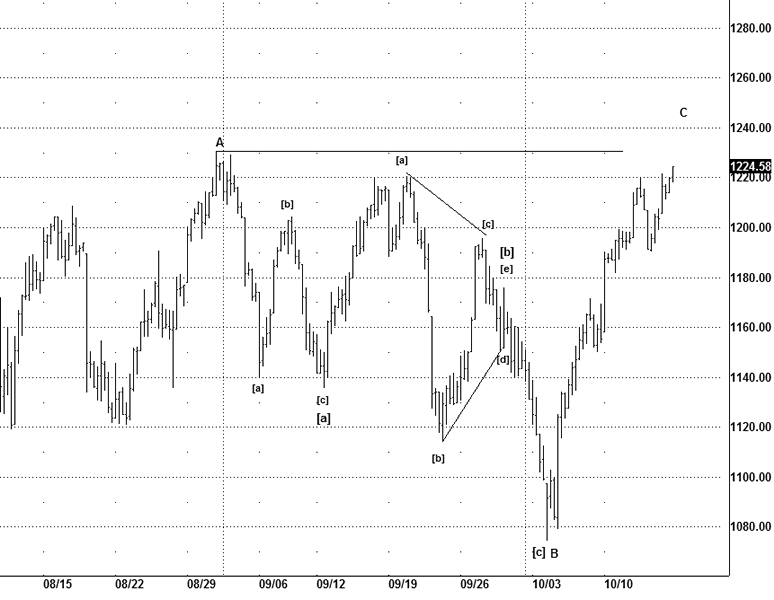
Currently the primary count is that of an expanded flat, the move you have seen is that of a wave C, the decline into the Oct 4th lows is a suspected B wave, it makes sense as it thrusted out of triangle and reversed aggressively, with the aggressive move you saw in stocks it fits the profile of this pattern well.
With a target of the wave A crest at 1230SPX, it likely has a bit higher to go before finally topping out.
But we are on high alert for any failure; however they are a few other patterns that suggest a bit higher in "risk on" early next week.
If that is indeed the case, the market is then likely setting up for a monster reversal lower and with the shorts having been forced out of their positions, if the buyers don't step up, I fear the market is going to witness a move like the decline we saw earlier in the year, that essentially count be a crash type and a "no bid".
Whilst I have expected a test of 1240SPX I can't say seeing it so soon was a setup I was expecting, this market I suspect surprised many by the sheer aggression it took, even some 30yr veterans from the CME can't recall a move like that seen in the markets.
NDX
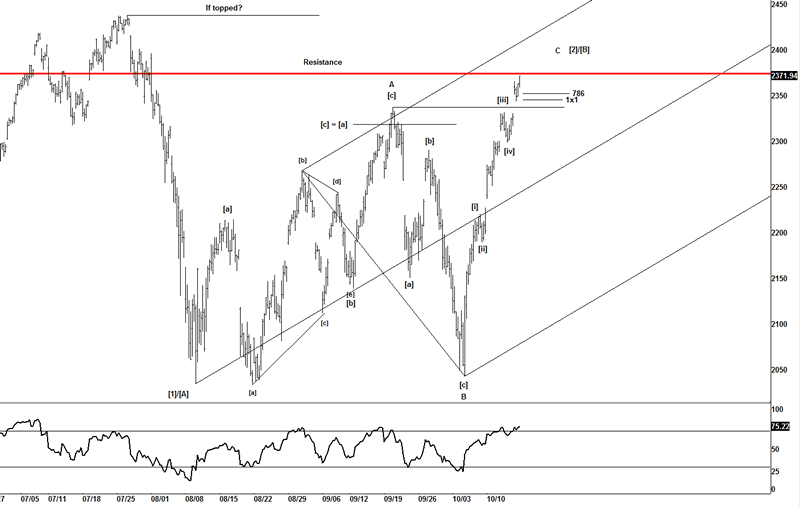
One of the reasons I think the SPX is tracing out an expanded flat is that the NDX looks a perfect example of a 3 wave move as a B wave, where I see many Elliotticians labeling the decline into the Oct 4th lows as some sort of Ending Diagonal on the SPX, but in the authors mind that is what is referred as "forced counting" i.e. fitting an agenda to a bias, it's not an Ending Diagonal, it fails to meet the criteria set for that of a contracting Ending Diagonal pattern.
If you look at the NDX, it shows a clear 3 wave move as a B wave for a flat; hence the idea that I think the SPX is working the same idea.
A flat is a 3-3-5 pattern, and what I suspect you have just seen is that of the final leg of the pattern as the wave C is a 5 wave move.
AAPL
Earlier in the week, I started hunting around for why the NDX was on a mission higher, it was clear in my mind that the market had an agenda, and I needed to find out what that was, the market won't be going lower when you have super stocks that have a huge weighting on the markets continuing to push higher, that's a fact, whilst you can comment on volume and lagging sectors, the weight of the market generally is moved by the super stocks such as AAPL.
In order for any market to go lower, or higher, you need the momo stocks and the big stocks to align with the direction of the markets.
In the case of AAPL, it became clear what was going on early this week, and once I worked it out I knew that the market was going higher and AAPL had unfinished business with the upside.
Looking at a long term idea I have been tracking for a while, it became clear that the market had likely a new high on the agenda. Back in September, I had labeled the high to a 5 wave pattern that started as far back as January 2009, and with the impulsive decline it looked like the market was following the script nicely, but with the strength shown over the past 2 weeks, it was becoming clear that a new script was being suggested, and what likely happened is that we ended wave [4] and need to put in a new high and what I thought was the high for a long term wave count from January 2009 was in fact a B wave.
So targeting a new ATH and around the upper trend line at $430 would work well, but AAPL earnings come out next Tuesday, so I want to wait 1st till those get posted in case of a spike.
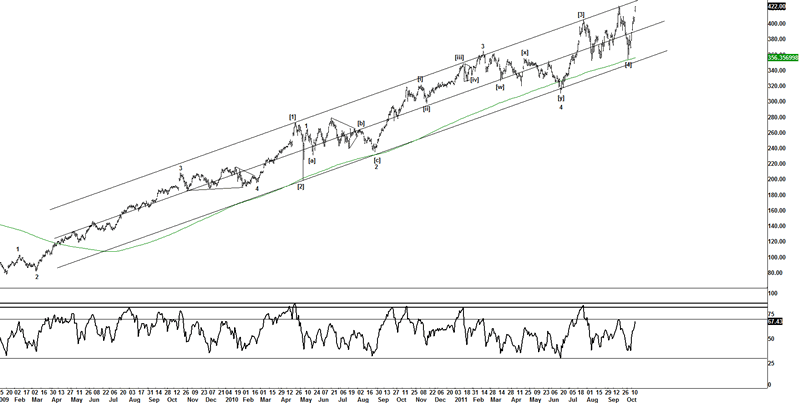
If you look at the RSI its clearly lagging and suggest that this is indeed a 5th wave. You don't need to be a genius to work out that where AAPL goes, so does the NDX, if the NDX leads the markets, then AAPL pays an important role in finding direction on the markets, again another key to building a plan, those that are looking hard enough, likely are the ones with the ideas and building a trading plan.
The clues are always there, you just got to go looking for those, once I figured out that AAPL was telling us about the NDX intentions, aligning the patterns in the SPX and NDX, finally made sense and that the SPX was I suspect in wave C as per the NDX idea, as AAPL was leading the NDX, hence you saw the aggressive impulsive move we have seen over the past few weeks.
From a bearish perspective, the market is pretty much at the point of no return, the bears need to deliver on the markets, or they are going to find themselves on the end of potential move like we saw back in 2010.
It's time for some hard and fast choices to be made, the reward here is a huge setup, if this works out as shown to the downside, its enormous compared to the risk involved, that's the kind of trade I like.
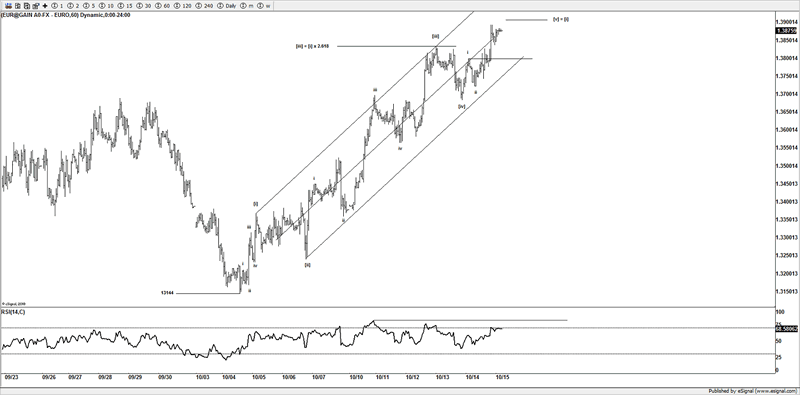
EUR vs ES
Most traders have heard the term "risk on" "risk off" currently the DX (US$) is the lynch pin to what the markets are doing, or you can follow the EUR/USD pair, as that is moving higher in a "risk on" environment.
So if you want to follow each other's markets, it pays to follow the pattern in those markets.
So from the Oct 4th lows, what is the EUR/USD working as a pattern?
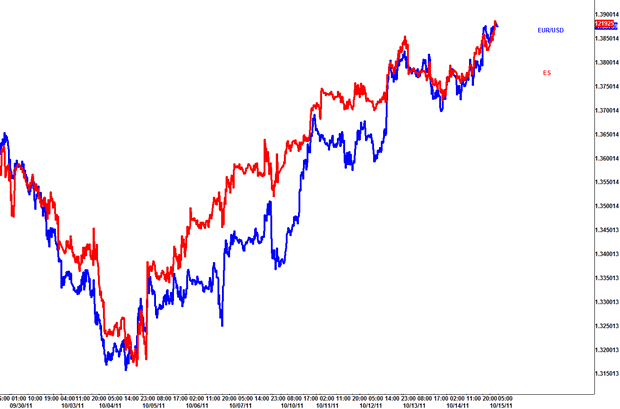
Well if the stock markets are in a suspected 5 wave pattern (wave C of a flat), then if we can work something similar on the EUR/USD then we could indeed have a setup to reverse.
If you look at the EUR/USD pair, it sure does looks like a clear 5 wave pattern coming to a suspect termination point soon, which aligns with the SPX and NDX ideas, as we have working counts in the NQ and ES contracts.
So it seems pieces of the puzzle look like they could indeed be forecasting of a reversal in risk.
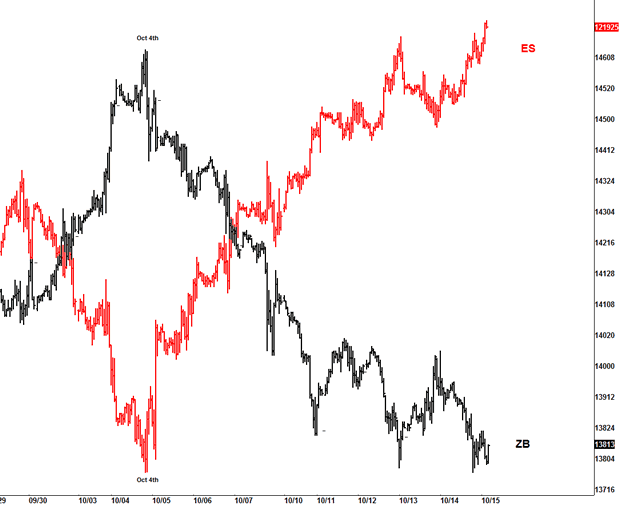
ZB vs ES
Another market than I follow which I suspect is suggesting a clue to a reversal in risk, is the 30 US Bond.
If you look at the move from the date of Oct 4th, you can clearly see that we have what I suspect is a 5 wave decline setting up, so another market that is suggesting a risk reversal setting up.
Conclusion
Looking at the markets on the whole I suspect we have some potential important intermediate reversals setting up, with clearer patterns in the markets now, we are expecting a reversal, although some minor upside is or can be seen, such as SPX moving to test the 1230SPX high etc, and the EUR/USD moving a bit higher.
The move seen over the past few weeks has been strong, far far stronger than I had originally thought, but 1240SPX was a target I had in mind, the route at which the market appears to be taking or I should has already took, is something I gave a very low odds chance, I guess the market really did "stick it" to the majority of traders.
But as the markets move and change its up to the skill of the technician to pull the various prices together, which looking at what I seen the past few days and the charts I have posted to members this weekend already, we are confident that we should have some great moves coming shortly and we intend to take part in those moves.
Until next time.
Have a profitable week ahead.
Click here to become a member
You can also follow us on twitter
What do we offer?
Short and long term analysis on US and European markets, various major FX pairs, commodities from Gold and silver to markets like natural gas.
Daily analysis on where I think the market is going with key support and resistance areas, we move and adjust as the market adjusts.
A chat room where members can discuss ideas with me or other members.
Members get to know who is moving the markets in the S&P pits*
*I have permission to post comments from the audio I hear from the S&P pits.
If you looking for quality analysis from someone that actually looks at multiple charts and works hard at providing members information to stay on the right side of the trends and making $$$, why not give the site a trial.
If any of the readers want to see this article in a PDF format.
Please send an e-mail to Enquires@wavepatterntraders.com
Please put in the header PDF, or make it known that you want to be added to the mailing list for any future articles.
Or if you have any questions about becoming a member, please use the email address above.
If you like what you see, or want to see more of my work, then please sign up for the 4 week trial.
This article is just a small portion of the markets I follow.
I cover many markets, from FX to US equities, right the way through to commodities.
If I have the data I am more than willing to offer requests to members.
Currently new members can sign up for a 4 week free trial to test drive the site, and see if my work can help in your trading and if it meets your requirements.
If you don't like what you see, then drop me an email within the 1st 4 weeks from when you join, and ask for a no questions refund.
You simply have nothing to lose.
By Jason Soni AKA Nouf
© 2011 Copyright Jason Soni AKA Nouf - All Rights Reserved
Disclaimer: The above is a matter of opinion provided for general information purposes only and is not intended as investment advice. Information and analysis above are derived from sources and utilising methods believed to be reliable, but we cannot accept responsibility for any losses you may incur as a result of this analysis. Individuals should consult with their personal financial advisors.
© 2005-2022 http://www.MarketOracle.co.uk - The Market Oracle is a FREE Daily Financial Markets Analysis & Forecasting online publication.