


How to build an Optimal Investment Portfolio with Markowatz's Portfolio Theory?
InvestorEducation / Risk Analysis Oct 23, 2012 - 06:55 AM GMTBy: Sam_Chee_Kong

 There have been many changes in today’s stock market trading landscape which is dominated by computers and ECN networks as compared to the ‘open outcry’ system that existed until the early 1980s. During those days markets are relatively inefficient in a way that price change does not reflect the change in the news and events. Those who can get hold of technologies will have the upper hand in trading the markets because they will receive the news much sooner than the rest of us. Those who possess telex, fax and computers will certainly have an advantage not only in receiving the news but also in executing the buy and sell orders.
However over the years due to the explosion of the information age the ‘technology gap’ between the big and small players had finally been narrowed. Difference in execution speed is only measured in milliseconds. But what investors soon find out that by buying and selling shares in the stock market is not the right strategy because in the long run they will still lose out. Being rational investors they also believe that by diversification they are able to reduce risk while maintaining the level of return on their portfolio. They need a portfolio that can withstand the test of time and at the same time risk can be reduced while returns remain the same.
Hence this gave rise to what we call the Portfolio Theory. Why the need for a Portfolio and not just hold on to one asset and the rest in cash? Imagine having all of one’s money into a single asset or security, the risk will be very high indeed. If anything were to happen to the asset or security then the person’s wealth will be wipe out. Hence, the main reason for having a Portfolio is diversification and by combining different securities with different risk and returns it will help reduce the overall risk of the portfolio. Similarly if a country depends only on one commodity which is rubber then that country’s export earnings will be dependable on that commodity’s harvest. If it had a bumper harvest then all is well but what if it had a poor harvest? In others words it is very risky to depend on only one product. That country’s government can help reduce its risk of having volatile export earnings by planting different crops like palm oil, cocoa, pepper or other cash crops.
Markowitz’s Portfolio Theory
The Portfolio Theory is pioneered by Henry Markowitz in his book Portfolio Selection in 1952. The Portfolio theory assumes that investors are risk-adverse because when they are presented with 2 different securities with the same return but different risks they will prefer the security with the lower risk. Or put it another way returns can be maximize with a given level of risk by diversifying into different asset classes with different levels of risk and return.
To illustrate the Portfolio Theory the following assumptions are made.
- Investors are rational and risk adverse. By this we mean an individual expects to be compensated a return more than a risk free asset such as the Treasury bills for his risk taking ventures.
- Investors make their decisions based on the risk and return frame work. This model has no place for irrational investors where they expect to make their money as quick as they can and are willing to take enormous amount of risk in order to achieve that. It is equivalent to compulsive gambling. In Markowitz’s model there is a trade-off between risk and return. Higher risk will be compensated proportionately with higher return. This can be shown with the following graph.
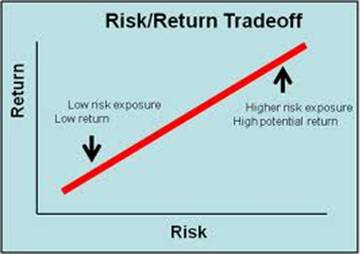
As can be seen from the Graph, in order to obtain a higher return higher risk would have to be taken and this can be represented by a movement from the left to the right of the graph.
Creating an Optimised Portfolio
So what are the criteria for the selection of securities to be included in an optimised Portfolio? Prior to the era of Markowitz, investors knew that there is a relationship between risk and return but they don’t know how to quantify it. To reduce risk they just diversify their portfolio by including many securities into their portfolio. However in Markowitz’s model both risk and the expected return are quantifiable.
Risk can be measured by using the standard deviation which in turn is the square root of the variance. The larger the standard deviation then the larger will be the risk.
Return in Markowitz’s model can be defined by the following equation.
R = (P1 – P0 + D) / P0
Where,
R = Return on the security
P1 = Current Price
P0 = Previous Price (months before Current Price)
D = Dividend
Or put it in simpler terms,
Return = (capital gain or losses) + dividend
Divided by Previous Price
As can be seen from the above, the return of a security depends on variables P1 and D. The higher the Current Price or Dividend then the return to the security will be higher.
It is very difficult to predict the future price of a security due to its random variable in nature. Ceteris paribus when a firm increases its Dividend then its Share Price will be increased due to higher demand. However the performance of a company is affected by the following risks during a company’s operation.
- Internal Risk. This part of the risk is diversifiable which include business risk such as labour strike, poor response to new products, power outage, losing talented staff and etc. Another is the interest rate risk which is due to its high debt load and it will affect the bottom line of a firm. If a firm cannot manage its internal risk well then its operating income will be unstable and hence will affects its share price.
- External Risk. This is also refers as Market Risk which is out of control by the firm. A good example is the increase in the interest rate by the banks which cannot be diversifiable by the firm. An increase in the interest means increase costs and hence will affect its bottom line. Another Market risk is the Global Systemic Financial Crisis. During a financial crisis like what is happening in the Western economies now will surely affects the demand of manufactured goods and raw materials from the rest of the world. Hence the performance of manufacturers from exporting countries will surely be affected and hence their bottom lines and also share prices.
Security Selection for Portfolio
Since now we are now able to quantify both risk and return then we can proceed to select securities based on Markowitz’s assumption to build our Portfolio. Based on Markowitz’s model a rational investor will do the following.
- If two securities have the same expected return then the investor will choose the one with the lower standard deviation (risk)
- If two securities have the same standard deviation (risk) then the investor will choose the one with the higher return.
In the following we shall build a model to illustrate the above point
Table 1 – Same Risk but different Expected Return
As can be seen from the above the standard deviations for the 5 securities are the same but expected returns are different. Needless to say as a rational investor he will choose security 5 because with the same risk it offers the highest expected return (0.15)
Table 2 – Same Expected Return but different Risk
As can be seen from the above the Expected Returns for the 5 securities are the same but the level of Risk is different. Needless to say as a rational investor he will choose security 1 because with the same Expected Return it offers the lowest Risk (0.1)
Table 3 – Different Expected Return and Risk
From the above the Expected Returns for the 5 securities are different from the level of Risk. In this case the higher the risk the higher will be the Expected Return. Which security the investor will choose? It will depend on the risk appetite of the investor. If his risk appetite is high then probably he will prefer security 5 because it offers the highest expected return. If he is risk adverse then he will prefer security 1.
Most optimal Risk Dispersion Portfolio
So from the above we can observe that by combining different securities through diversification, we is able to reduce risk. But the question is how many securities shall we own so that the portfolio will be at the lowest risk possible? In a study by Elton and Gruber titled ‘Risk reduction and Portfolio Size’, Journal of Finance, they found that the risk associated with a portfolio can be reduced by adding more securities. The following is the table on risk dispersion with the number of securities.
Table 4 – Elton & Gruber Risk Diversification
As can be seen from above the maximum risk dispersion can be attained when the number of securities increased from 1 to 20. After that the Law of Diminishing Returns prevail where any further addition of securities will not reduce risk much more significantly. The difference in the portfolio variance for holding 50 and 1000 securities is only 0.95 which can be considered negligible.
How to further optimize your portfolio
Having to know how many securities to hold in your portfolio is not good enough if most of them are perfectly correlated. This is because if the S&P were to go up down by 10% then your portfolio will also go down by 10%. Correlation coefficient is a mathematical measure of how closely related is the performance of a security to the market benchmark. For example it is a measure of how closely Apple share move in tandem with the Nasdaq Composite Index.
In fund literature it is known as the correlation coefficient or R-squared. The value of R-squared is between -1 and +1. If the value of R-squared is +1 means perfect positive correlation and a rise of 5% in the S&P will cause your security to rise by the same amount. If it is -1 then it is said to be perfect negatively correlated and a rise of 5% in the S&P will cause a 5% drop in your security. A reading of 0 means there is no correlation between your security and the S&P.
In other words if you are interested to minimise the risk of your portfolio then you are advised to hold securities that are perfectly negative correlated rather than perfectly positively correlated in your portfolio.
Conclusion
In summary despite some of the flaws in the Modern Portfolio Theory, it remains one the most commonly used method in Portfolio Management in many of the Institutional, Pension and Mutual funds. Markowitz’s Portfolio Theory revolutionizes how risky securities are able to be included into portfolios by being able to measure the risk of individual securities. A portfolio can only be considered optimal when it is standard deviation (risk) efficient. This means that for a given level of risk the portfolio should earn the maximum return or for a given level of return the portfolio should be at the lowest risk as possible. The above Portfolio model is able to outperform many private investor’s portfolio that are made up of index linked securities. Those index linked portfolios are also known to be perfectly positive correlated.
Up till now we are only able to build a diversified Portfolio which is Risk efficient but not Price efficient. Given a level of return we select the lowest risk securities for our Portfolio. We have no way to determine whether the securities selected are ‘price efficient or under value’. For this we need to look into the area of security pricing. Another area that we have yet to cover is the incorporation of other securities pricing models such as the Capital Asset Pricing Model (CAPM) and also the Arbitrage Pricing Theory (APT) into our Portfolio.
CAPM is the most commonly used model in the pricing of risky securities and assets in the financial industry. To further optimize our portfolio we can use the above models to determine both the expected return and current pricing of a security. Due to the depth of this subject we will need another article to explain the uses of both models in Pricing of Securities in the Financial Industry.
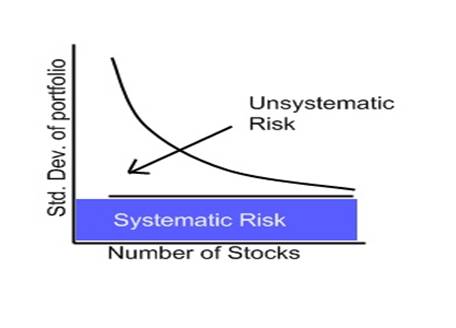
Further to this, an optimal portfolio must also be well diversified and also contain the least Internal or Unsystematic Risk as most of it are already taken care of by utilising the correlation coefficient. The only risk left will be the External or Systemic Risk which firms cannot do anything to avoid it. The following chart summarizes the effect of risk reduction which is correlated with the number of securities.
To sum things up, to create an Optimal and Robust Portfolio we will use the same approach that economists use to solve economic problems.
- Identify the problem
Our problem is to build an Optimal Portfolio
2. Build a model around it
We start to build several portfolios to include different securities with different risk and return factors
3. Fill the model with data to test it
Then we start to fill up the portfolio with a different combination of data to test its viability. If the result is not consistent enough then we will have to go back to step 2 to modify or build another new model. Then we select the best performing portfolio.
by Sam Chee Kong
cheekongsam@yahoo.com
© 2012 Copyright Sam Chee Kong - All Rights Reserved
Disclaimer: The above is a matter of opinion provided for general information purposes only and is not intended as investment advice. Information and analysis above are derived from sources and utilising methods believed to be reliable, but we cannot accept responsibility for any losses you may incur as a result of this analysis. Individuals should consult with their personal financial advisors.
© 2005-2022 http://www.MarketOracle.co.uk - The Market Oracle is a FREE Daily Financial Markets Analysis & Forecasting online publication.