


MAP Wave Analysis - Stock Market Clues of US Fiscal Cliff?
Stock-Markets / Stock Markets 2012 Nov 12, 2012 - 05:14 AM GMTBy: Marc_Horn

 In March MAP Wave Analysis projected the DOW ideal Q-2 reaching 13750 by November in Dow Stock Market Index Ready to Form a Major Top. Then in October the DOW failed to make a new high as detailed in DOW Stock Market Index 2007 Retest Failure – Game Over USA and in Best Stock Market Shorting Opportunity in 300 Years the context of the conclusions was detailed.
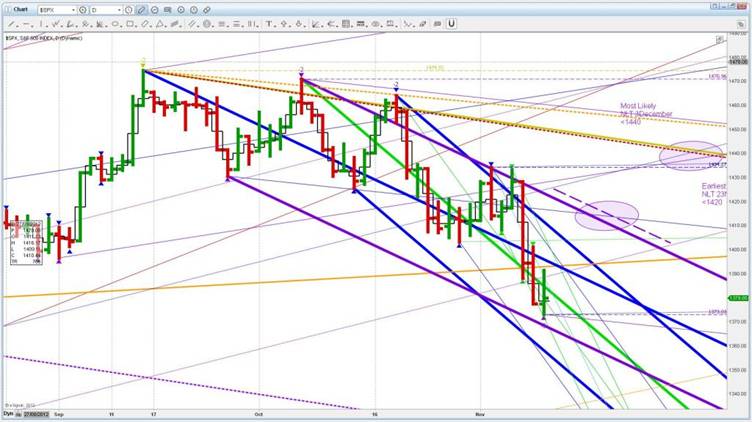
Those that follow my free blog received the following SPX update on the 16th October. In red at the end was this week ends update with current MAP Wave Analysis projections.
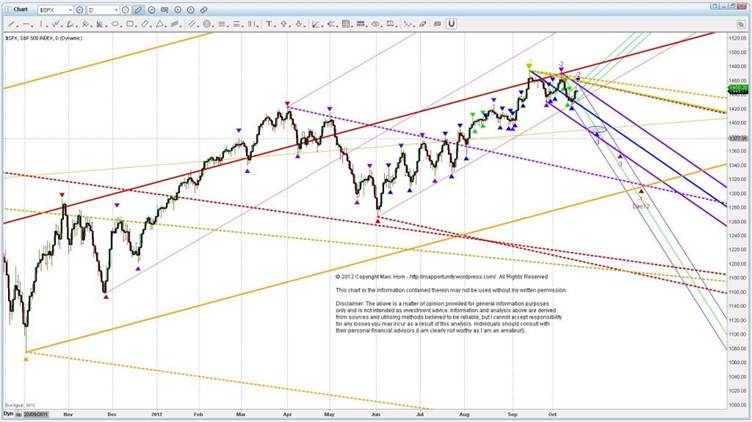
SPX big picture.
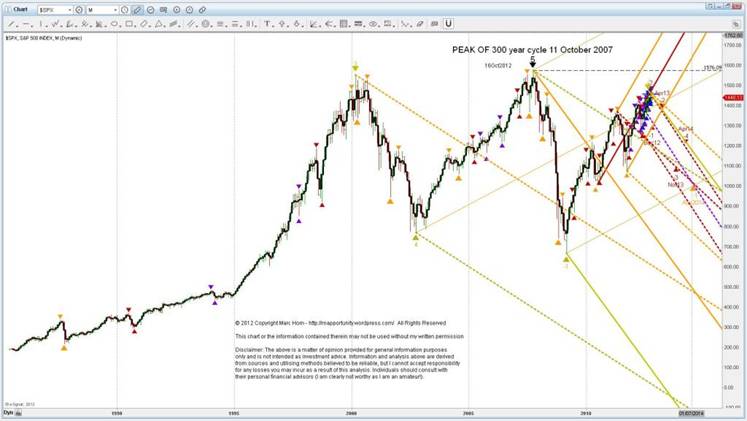
From 2000 top
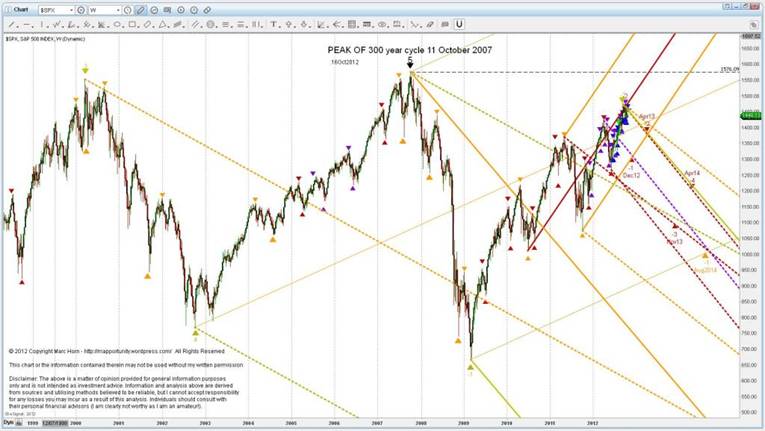
And again zooming in from 2007 top.
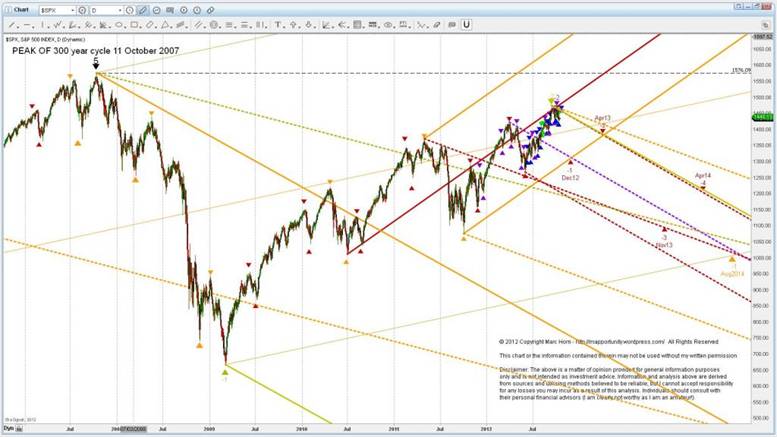
The current up wave off the 2007 bottom has a completed 5 MAP Wave count.
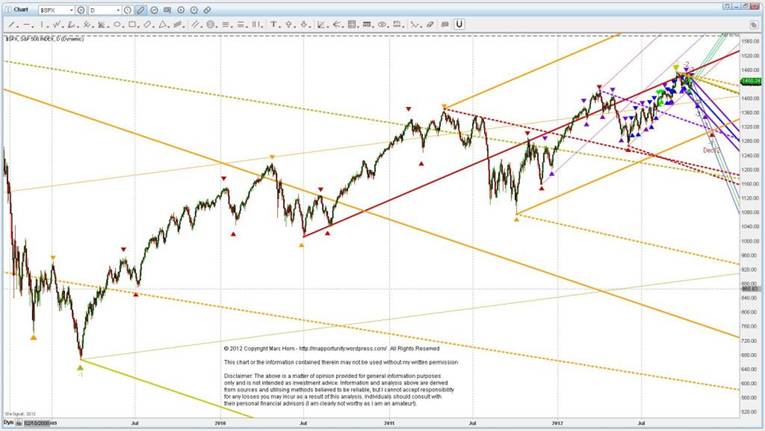
With the detail off last years lows with shorter term MAP Wave Analysis projections.
UPDATE 11 November 2012
I want to use this example to explain the different targets as I am constantly being asked about price time targets. Above we can see the expected ideal wave time and price targets based on the fractal wave structure on the 16th October. Below is what actually happened.
Pivot 4H-3 was made just above the ideal point previously shown where I estimated pivot 4H-2 would be made. 4H-4 was then made piercing D012MLH and 4H012MLH. Then to make its 5th pivot, which is also the next pivot on the D fractal wave scale D-3 it prices worked their way back down to the D012MLL and infact turned on the D012 extreme SP. So all in all very much as projected by MAP Wave Analysis!
It is extremely important to understand that turning points can only be determined from ACTUAL fractal wave formation, so ideal wave targets give approximate price time targets which get fine tuned as the waves develop.
So where to from here?
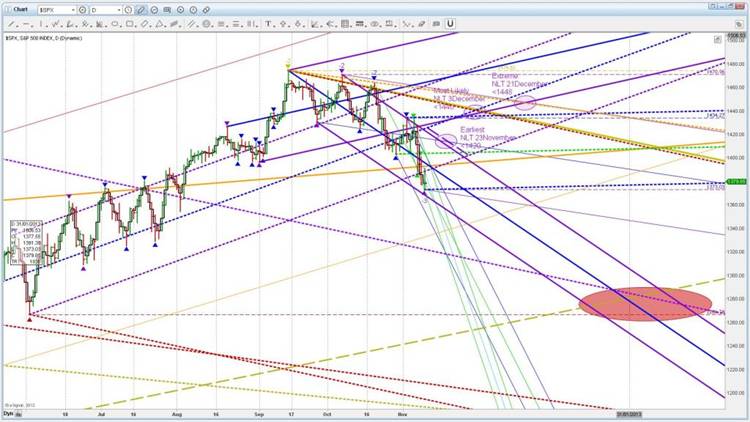
Above you can see I have shown 3 most likely locations for D-4, however the pivot can only be determined by following the fractal wave formation as it develops. Note that D012 is still the primary trend indicator and so looking at the projection it looks like we are going to have 5 tradeable 4H waves, with increasing volatility leading into a January / February bottom that will test Junes low to make W-1.
Common Sense - Looks like Obama will have a short post election bounce (D-4), followed by a lot of volatility with the budget deadline where the projections are showing a low (W-1), the result will be kicking the can down the road like the Europeans which will cause a retest of the recent highs (W-2), followed by new lows as reality starts to set in that the plan is not working - weekly wave 3 down!
In regards price time targets you will see that I do not use horizontal support - the reason is very simple - there is no predictive value of horizontal support as it is subjective to which pivots may or may not provide support or resistance. Subjectively it depends on where people tend to place their stops, and so gives some predictive substantiation based on peoples behaviour. You can see clearly that using a rule based non emotional objective methodology it certainly looks like support around 1266 will hold based on MAP Wave Analysis, and psychologically I am sure it will hold as it will give relief to those that still believe we are in a bull market.
I also do not use Fibonacci ratios - again the reason is simply - they are geometrically derived as are my wave forks so they give the same result except that with MAP analysis you get a simple clear picture as opposed to a series of possible turning points where you guess at which line it might turn.
MAP Wave Analysis, unlike Elliot Wave and Andrews Pitchforks are a systematic methodical rule based approach, details of which can be found either on my blog or here on The Market Oracle and data is archived and updated in a format that is traceable as shown in this SPX update, so that the system can be improved and used as a learning model. Additionally investors can evaluate its effectiveness when making investment decisions.
Click here to follow your duty of Use and copyright is described therein.:
Probabilities are derived from the MAP Analysis methodology described therein,
Click follow on my blog to receive regular FREE market updates and discussion.
For other articles published click here
For more information of how I do what I do http://mapportunity.wordpress.com/ . Comments and discussions very welcome!
The statements, opinions and analyses presented in this site are provided as educational and general information only. Opinions, estimates, buy and sell signals, and probabilities expressed herein constitute the judgment of the author as of the date indicated and are subject to change without notice.
Nothing contained in this site is intended to be, nor shall it be construed as, investment advice, nor is it to be relied upon in making any investment or other decision.
Prior to making any investment decision, you are advised to consult with your broker, investment advisor or other appropriate tax or financial professional to determine the suitability of any investment.
© 2012 Copyright Marc Horn - All Rights Reserved Disclaimer: The above is a matter of opinion provided for general information purposes only and is not intended as investment advice. Information and analysis above are derived from sources and utilising methods believed to be reliable, but we cannot accept responsibility for any losses you may incur as a result of this analysis. Individuals should consult with their personal financial advisors.
© 2005-2022 http://www.MarketOracle.co.uk - The Market Oracle is a FREE Daily Financial Markets Analysis & Forecasting online publication.