


Uranium Stocks Await Breakout From Consolidation Area
Commodities / Uranium Feb 21, 2008 - 12:57 AM GMTBy: Merv_Burak
 The Index close was on the up side again but almost everything else was telling me the market was more down than up. The potential topping activity is still evident on the chart. Although the close was on the plus side the daily high and daily low were both lower than yesterday's values. Although I have drawn a resistance line from the top of the mid-Jan activity maybe the early Feb highs are really the resistance, at least they are so far.
The Merv's Daily Uranium Index closed up 0.029 points or 0.85%. Nibble, nibble on the up side. We need a zoom. The winners and losers were more on the down side with 20 winners and 23 losers. 7 stocks closed unchanged. The best daily performer was Khan Resources with a super gain of 25.0% while the worst performer was Xemplar Energy with a loss of 9.4%.
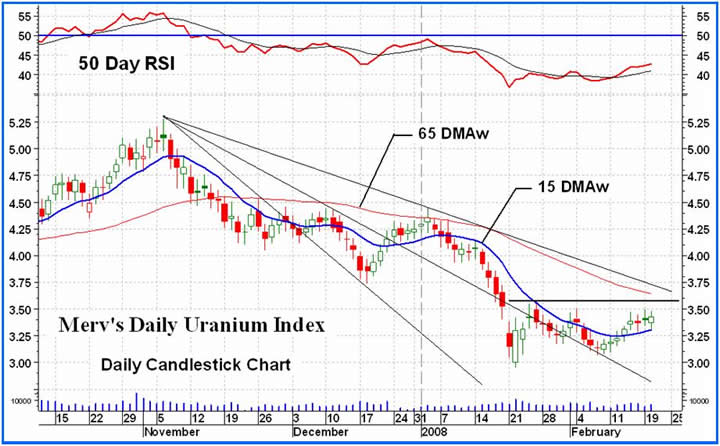
I'm still waiting for something to change on the intermediate term but nothing seems to change. The Index is below its negative moving average line with the two continuing to close the gap. The momentum indicator continues to point gently higher but remains in its negative zone, above its positive sloping trigger line. The volume indicator continues to move higher above its positive trigger line. Although there are a few positive indicators they are more of the advance warning type rather than indications of reversals. Therefore I continue to rate the intermediate term as BEARISH .
On the short term the more aggressive indicators are suggesting the turn around is still in effect despite the daily Index advance. The Stochastic Oscillator has topped and is moving lower, below its now negative sloping trigger line. It is, however, still in its positive zone so the turn around may be short lived. As for the normal short term indicators, the most important is the moving average info. The Index remains above its positive moving average line while the momentum indicator is just touching its neutral line but still a hair inside the negative zone. It is above its positive trigger line and one more day of upside Index action and this indicator will go positive. The volume indicator is above is positive trigger line. Putting all this together I am still rating the short term as BULLISH but with a few warning bells to watch.
Gamblers may have a field day at times like this with many stocks in the turning process BUT speculators and investors should wait for the turns to be confirmed or they mat be taking greater risks than they expect.
By Merv Burak, CMT
Hudson Aero/Systems Inc.
Technical Information Group
for Technically Uranium with Merv
Web: http://techuranium.blogspot.com/
e-mail: merv@themarkettraders.com
During the day Merv practices his engineering profession as a Consulting Aerospace Engineer. Once the sun goes down and night descends upon the earth Merv dons his other hat as a Chartered Market Technician ( CMT ) and tries to decipher what's going on in the securities markets. As an underground surveyor in the gold mines of Canada 's Northwest Territories in his youth, Merv has a soft spot for the gold industry and has developed several Gold Indices reflecting different aspects of the industry. As a basically lazy individual Merv's driving focus is to KEEP IT SIMPLE .
This Blog is - A periodic review of the daily or weekly market action in uranium stocks. The review is strictly from the technical perspective. Merv is a pure market technician. Weekly, one will find a table of technical information and ratings of the 50 component stocks of the Merv's Uranium Index as well as a weekly summary of the uranium stock activity. Daily (most days), one will find a daily review of the market action of the Merv's Daily Uranium Index as well as technical analysis of one or more uranium stocks of interest.
Disclaimer - Technical analysis is not perfect. Should you expect perfection this is not the site for you.
Technical analysis IS a very sound technique to assess the daily or weekly trading activities in securities and to assess appropriate timing of investment activities. This blog provides such technical analysis of the trading activity in uranium stocks for your information. Any use made of this information is strictly at the users risk. No guarantees are made for the accuracy or potential for the information provided herein. Use at your own risk. You are strongly advised to check with your broker or investment adviser before activating any investment desisions.
Merv Burak Archive |
© 2005-2022 http://www.MarketOracle.co.uk - The Market Oracle is a FREE Daily Financial Markets Analysis & Forecasting online publication.