Silver Investment Strategy - Knowing when to Sell
Commodities / Forecasts & Technical Analysis Feb 22, 2007 - 12:10 AM GMTBy: Roland_Watson
As we anticipate the next and final leg of phase I of the precious metals bull market, investors need to be ready with their exit strategies if they wish to unload all or part of their assets in a profitable manner.
Not all holders of gold and silver will be of this mind, each has their own reason for holding or not holding any part of their investment. Either way, you need to be sure what you are going to do as silver begins to move in leaps and bounds towards the next major price peak.
To that end, The Silver Analyst has one or two strategies in mind. Though we do not claim to offer foolproof timing, we at least hope to be there or thereabouts before silver takes its next big dive into price correction territory. We have already mentioned our unique long term SLI indicator in previous articles, but today I would like to focus on the venerable 200 day moving average as it applies to silver.
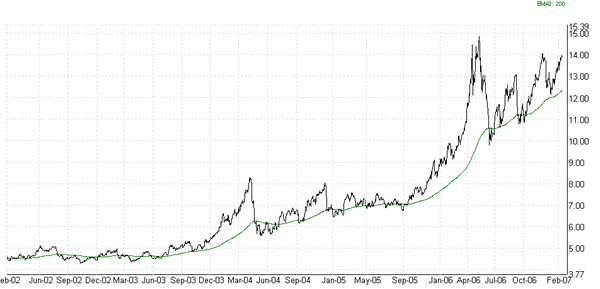
A look at the five-year chart below shows how the silver price has tended to hug the trend line based upon this medium term moving average. A judicious use of the 200-day moving average during corrective periods has given useful buy points for investors and traders as this bull market has progressed.

However, the same could not be said of exit points based upon this indicator. The volatility of the silver price has tended to make any attempt to find a relationship between the two prices for exit points rather difficult. One good way to quantify this has been explained by the erudite Adam Hamilton of Zeal Intelligence. He proposed a "relative" moving day average that simply divides the current price of an asset by its 200 day moving average.
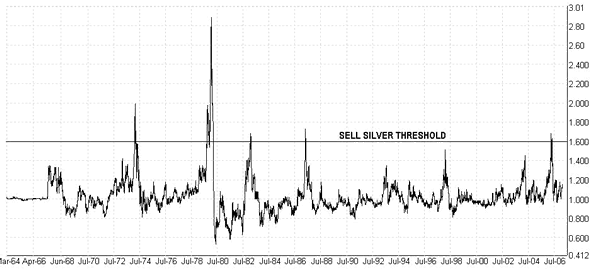
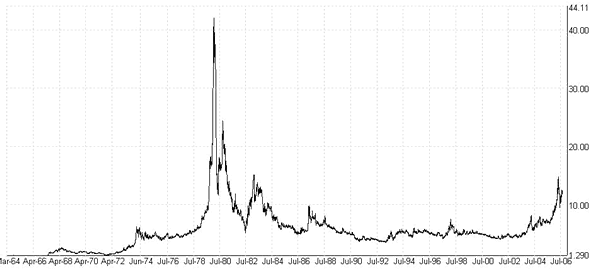
Now, though this has proven to have applicability in investments such as gold, silver has proven to be a bit more of a slippery fish due to its price volatility. If we calculate this relative moving average (RMA) over the last 45 years of silver prices, we get the following chart and reproduce the corresponding silver price chart below it for comparison.


We do get a degree of variability in the spread of sell signal peaks, but let us attempt to set our sell threshold and back test it against some noticeable silver highs. We have set a threshold of 1.60. In other words, a sell signal is generated if the RMA hits this threshold. This threshold was set based on the optimal number of true and false sell signals that may be generated. If the RMA threshold is set too high, nothing triggers. If it is set too low, too many false exits signals will be generated. The results of back testing this threshold are shown below.
| Peak Date |
Peak Price |
Exit Date | RMA | Exit Price |
Distance below peak |
| 20/05/68 | $2.65 | NO SIGNAL | |||
| 26/02/74 | $6.26 | 07/02/74 | 1.60 | $4.86 | 22% |
| 21/01/80 | $42.07 | 14/09/79 | 1.62 | $13.97 | 67% |
| 16/02/83 | $15.15 | 28/01/83 | 1.60 | $14.51 | 4% |
| 27/04/87 | $9.80 | 24/04/87 | 1.72 | $9.80 | 0% |
| 06/02/98 | $7.60 | NO SIGNAL | |||
| 06/04/04 | $8.25 | NO SIGNAL | |||
| 11/05/06 | $14.78 | 17/04/06 | 1.60 | $14.09 | 5% |
Explaining the columns, the Peak Date is the particular date on which silver hit a significant closing price high (the Peak Price) . If the RMA hit 1.6 or more to issue a sell signal, the Exit Date gives the date on which this happened. The RMA column gives the value at which this happened or NO SIGNAL if the RMA failed to hit 1.60 at all.
So, if the RMA triggers a sell on the Exit Date , we assume that the investor gets out on the next trading day at the displayed Exit Price . Finally, the Distance Below Peak states how far below the Peak Price we managed to get out at as a percentage. If that percentage was 0% then we got out right at the top! As you can see, the results are mixed. The RMA gave good results for three price peaks. It was way out with the 1980 peak while it failed to trigger at all for three price peaks.
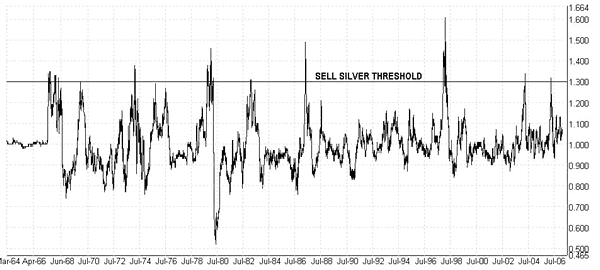
In that light, I wondered if it was possible to improve the signal to noise ratio by smoothing out the volatility in a consistent manner. After experimenting with some price filtering formulae, I came up with a legitimate and proprietary formula that smoothes out the wild swings in the silver RMA. I renamed this the relative moving average refinement or RMAR and the corresponding 45-year chart is shown below.

Compare this to the RMA chart and notice how there is a more even distribution to the spikes. Based on this chart, we reset the sell signal threshold to any value at or above 1.30. We then back tested the price peaks again to get the corresponding result table below.
| Peak Date |
Peak Price |
Exit Date | RMAR | Exit Price |
Distance below peak |
| 20/05/68 | $2.65 | 24/11/67 | 1.300 | $2.17 | 18% |
| 26/02/74 | $6.26 | 13/02/74 | 1.320 | $5.31 | 15% |
| 21/01/80 | $42.07 | 20/09/79 | 1.320 | $16.18 | 62% |
| 16/02/83 | $15.15 | 02/02/83 | 1.310 | $14.45 | 5% |
| 27/04/87 | $9.80 | 23/04/87 | 1.340 | $9.72 | 1% |
| 06/02/98 | $7.60 | 10/12/97 | 1.320 | $5.92 | 22% |
| 06/04/04 | $8.25 | 01/04/04 | 1.300 | $8.12 | 2% |
| 11/05/06 | $14.78 | 17/04/06 | 1.300 | $14.09 | 5% |
Based on this refined technique we get a definite improvement in the exit results. Firstly, all eight historical price peaks have RMAR sell signals; the RMA only issued five sell signals. However, we notice that catching the famous 1980 peak is still a failure albeit an improved one - 62% from the peak as against 67% for the RMA. It seems that our longer term SLI indicator is better suited to that task!
If we compare the two tables and ask whether the new RMAR beat the equivalent RMA signal, we get the final table below.
| Peak Date | RMAR Better? |
| 20/05/68 | YES |
| 26/02/74 | YES |
| 21/01/80 | YES |
| 16/02/83 | NO |
| 27/04/87 | NO |
| 06/02/98 | YES |
| 06/04/04 | YES |
| 11/05/06 | EQUAL |
In five out of eight cases, the RMAR was better at predicting the silver top than the RMA. In two cases, the RMA was better and in one case, it was a dead heat. Now I realize that one could vary the sell thresholds and perhaps get different results, but I suspect they will not be that different. Please email me if you have better suggestions for thresholds.
The RMAR indicator is one of several indicators calculated and tracked in The Silver Analyst newsletter. As we approach new important price highs in silver this or next year, silver investors need to be armed with the best indicators for their exit strategy.
We commend the RMAR indicator as one such quiver to your bow.
By Roland Watson
http://silveranalyst.blogspot.com
Further analysis of the SLI indicator and more can be obtained by going to our silver blog at http://silveranalyst.blogspot.com where readers can obtain the first issue of The Silver Analyst free and learn about subscription details. Comments and questions are also invited via email to silveranalysis@yahoo.co.uk .
© 2005-2022 http://www.MarketOracle.co.uk - The Market Oracle is a FREE Daily Financial Markets Analysis & Forecasting online publication.


