


U.S. Household Net Worth: The ”Real” Story
Economics / US Economy Dec 07, 2012 - 04:42 AM GMTBy: PhilStockWorld

 Courtesy of Doug Short writes: A quick glance at the complete household net worth data series in a linear chart shows a distinct bubble in net worth that peaked in Q4 2007 with a trough in Q1 2009, the quarter the equity markets bottomed. The latest Fed balance sheet shows a total net worth that is 26.4% above the 2009 trough but still 3.8% below the 2007 peak. The nominal Q3 net worth is up 2.7% from Q2 and up 10.4% year over year.
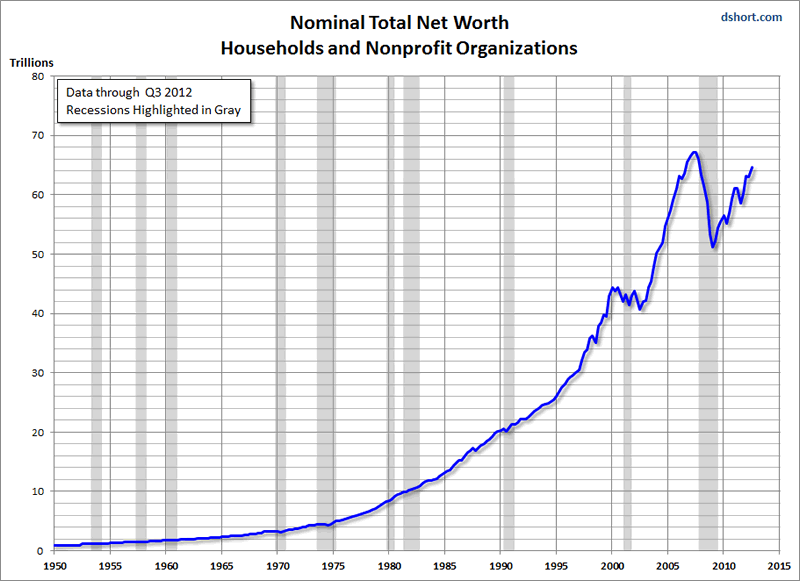
But there are problems with this analysis. Over the six decades of this data series, total net worth has grown over 5000%. A linear vertical scale on the chart above is misleading because it fails to provide an accurate visual illustration of growth over time. It also gives an exaggerated dimension to the bubble that began in 2002.
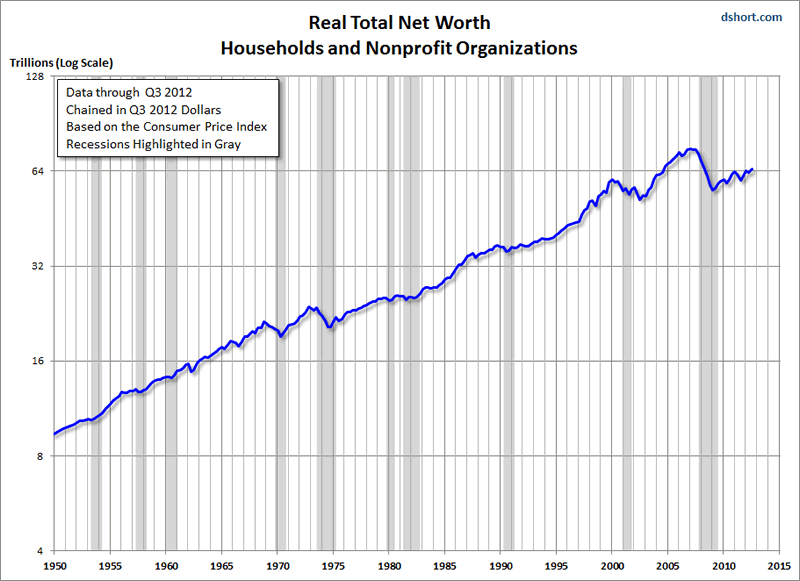
But there is another more serious problem, one that has to do with the data itself rather than the method of display. Over the same time frame that net worth grew by 5000-plus percent, the value of the 1951 dollar shrank to about a dime. The Federal Reserve gives us the nominal value of total net worth, which is significantly skewed by money illusion. Here is my own log scale chart adjusted for inflation using the Consumer Price Index.
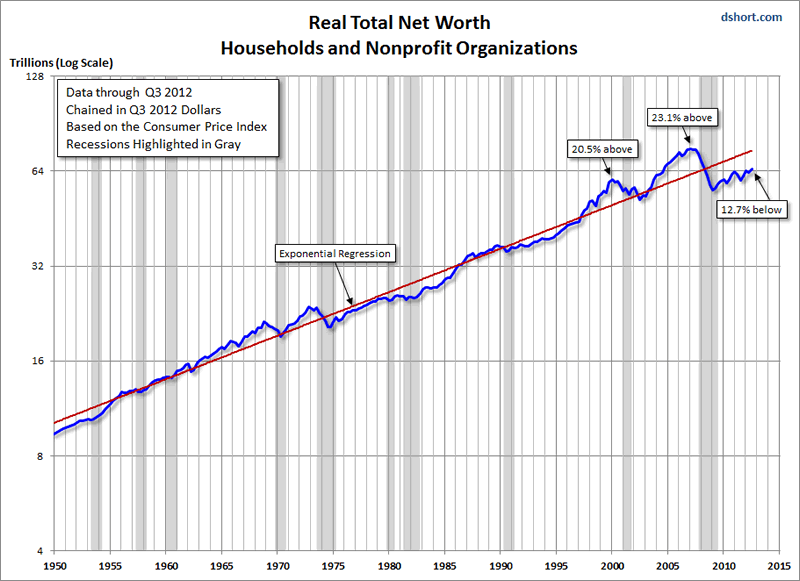
Here is the same chart with an exponential regression through the data. The regression helps us see the twin wealth bubbles peaking in Q1 2000 and Q1 2006, the Tech and Real Estate bubbles. The trough in real household net worth was in Q1 2009. From that quarter to the latest data point, net worth has been trending at about the same growth rate as the overall regression, but we are currently 12.7% below the regression.
Let’s now zoom in for a closer look at the period since 2000. I’ve added some callouts to highlight where we are currently with regard to the all-time peak and 2009 trough.
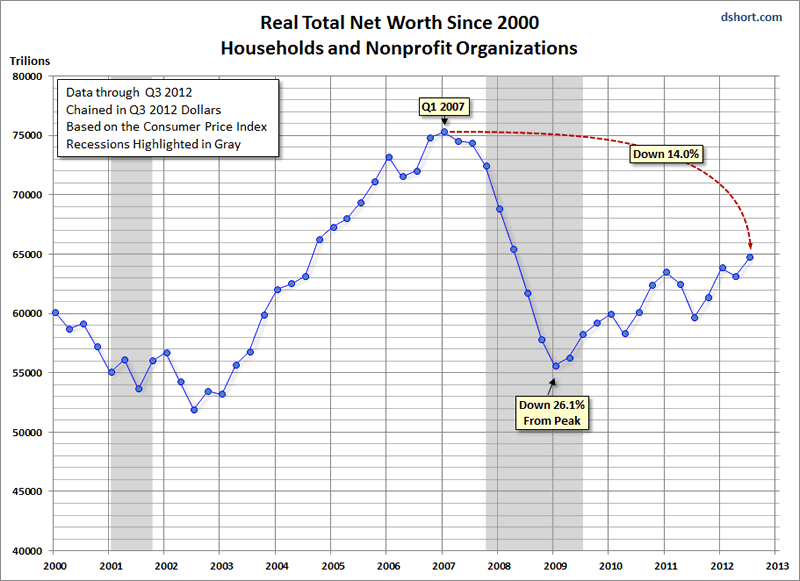
Let’s now compare the nominal and real statistics for the peak-to-trough and recovery-to-date.
■Peak: The nominal peak occurred in Q3 2007; the real peak occurred in Q1 2007. The Q3 2012 nominal net worth is 3.8% below peak. The real net worth is 14.0% below peak.
■Trough: The nominal and real troughs occurred in Q1 2009, the same quarter in which the market bottomed. The nominal peak-to-trough decline was 23.9%. The real decline was 26.1%.
■Recovery to date: The latest Flow of Funds report shows a nominal recovery of 26.4% off the trough. The real recovery is 16.4%.
■Quarter-over-quarter: Nominal total net worth in Q3 increased 2.7% from Q1. The real increase was 2.5%.
■Year-over-Year: Nominal total net worth in Q3 rose 10.4% from Q3 2011. The real increase was 8.6%.
We’ll take another look at the nominal and real numbers after the release of the Q4 2012 Flow of Funds data in March.
--------------------------------------------------------------------------------
Note: I’ve referred to this data series as “household” net worth. But, as I show in the chart titles, it also includes the net worth of nonprofit organizations. The ratio of two isn’t clearly defined in the Fed data, and it obviously varies by asset and liability component. I’ve seen estimates that the nonprofit component is around six percent of the total net worth.
One easy (and rather illuminating) point of comparison in the Flow of Funds data is the relative share of real estate at market value (B.100 lines 3, 4, and 5). In the latest report, nonprofit organizations account for 6.1% of combined household and nonprofit real estate (unchanged from last quarter). That percentage in the quarterly data has ranged from a high of 9.2% in 1974 to a low of 4.0% in Q4 2004, a few of quarters before the peak in the residential real estate bubble.
- Phil
Philip R. Davis is a founder of Phil's Stock World (www.philstockworld.com), a stock and options trading site that teaches the art of options trading to newcomers and devises advanced strategies for expert traders. Mr. Davis is a serial entrepreneur, having founded software company Accu-Title, a real estate title insurance software solution, and is also the President of the Delphi Consulting Corp., an M&A consulting firm that helps large and small companies obtain funding and close deals. He was also the founder of Accu-Search, a property data corporation that was sold to DataTrace in 2004 and Personality Plus, a precursor to eHarmony.com. Phil was a former editor of a UMass/Amherst humor magazine and it shows in his writing -- which is filled with colorful commentary along with very specific ideas on stock option purchases (Phil rarely holds actual stocks). Visit: Phil's Stock World (www.philstockworld.com)
© 2012 Copyright PhilStockWorld - All Rights Reserved Disclaimer: The above is a matter of opinion provided for general information purposes only and is not intended as investment advice. Information and analysis above are derived from sources and utilising methods believed to be reliable, but we cannot accept responsibility for any losses you may incur as a result of this analysis. Individuals should consult with their personal financial advisors.
PhilStockWorld Archive |
© 2005-2022 http://www.MarketOracle.co.uk - The Market Oracle is a FREE Daily Financial Markets Analysis & Forecasting online publication.