


Stocks Stealth Bull Market Trend Forecast 2013 and Beyond
News_Letter / Stock Markets 2013 Mar 04, 2013 - 12:33 PM GMTBy: NewsLetter
 The Market Oracle Newsletter
February 10th , 2013 Issue # 4 Vol. 7
Stocks Stealth Bull Market Trend Forecast 2013 and BeyondStocks Stealth Bull Market 2011 Ebook Direct Download Link (PDF 2.8m/b) Interest Rate Mega-Trend Ebook Direct Download Link (PDF 2.3m/b) Inflation Mega-Trend Ebook Direct Download Link (PDF 3.2m/b) Dear Reader The Dow Jones stock market index last closed at 13,992, having traded to a new intra-day bull market high of 14,022 and is well within 200 points of the all time closing high of 14,164 set on 9th October 2007 which has left many investors who have missed what amounts to a 4 year bull market asking the question whether they should buy now or not? In this 2nd of a two part series I will seek to conclude towards a detailed trend forecast for stock market for the whole of 2013 and into early 2014. Part 1 (Going Beyond the Proton Gradient - Stocks Stealth Bull Market Analysis 2013 ) - Dealt with the broader drivers for stocks and financial markets -
The Conclusion of Part 1 The overall big picture is one of exponential inflation as a consequence of government money printing fraud and the technological human productivity boosting mega-trends brought to competitive markets around which asset price booms and busts oscillate ever higher. Have Central Bankers Saved the World? The, US, UK and Japan to name the biggest money printers have averted financial armageddon collapse that so many books have been written to proclaim as being imminent. This is why there has not and will not be deflation. So yes technically, and fraudulently (debasing currencies) central banks have saved the world! A controversial and bitter statement to make but it is also a true statement. Something that many analysts cannot get their heads around as they wait for financial armageddon to play out in an always imminent bear market to resume. I say to them - the data you are looking at is 4 years old ! Your stuck in a time warp that is BLIND to what central bankers have done and are flagging will continue to do until economic growth returns to trend, regardless of the inflationary consequences. An example of central bankers saving the world is the fact that the euro-zone has NOT collapsed, even bankrupt Greece is still IN the euro-zone. Even I got that one wrong! Which means that we are collectively underestimating how far central banks will go. I still believe that something has got to give in the euro-zone because the current status quo is unsustainable but which is now clearly set against central bank actions. The bottom line is central banker actions to save the world economy has its consequence in the debasement of all currencies which means ongoing INFLATION. Therefore this continues to confirm my point of view that central banks, regardless of what they state in public, have instead in practice long since abandoned inflation targeting. Now there is one big problem with that which government's and central banks have been engaged in (QE- money printing to buy bonds), and that is what lies at the end of this road which is WAR as so much of government debt will have been monetized that investors lose confidence in holding bonds, which means that the government no longer has access to foreign currency or gold to buy imports, because they can buy bonds but only foreign investors can give them currency to buy imports in exchange for bonds. This is what drives countries into war of conquests for land, wealth (gold) and resources. As an example, and contrary to most academic history books, this is what was the primary driver for Nazi Germany's wars of conquest as the German state tried to stay one step ahead of bankruptcy that demanded ever escalating grabs for territory and resources as Germany systematically stole the wealth of each country they conquered to finance the war-fare state through theft of each countries assets and through taxation. Therefore at some point, unless the money printing trends are reversed then there will be wars that will make Iraq look like a picnic. The Self Fulfilling Prophecy The central banks are playing the game of the self fulfilling prophecy - Inflate asset prices to inflate the economy which acts as feed back loop, which is why the stock market leads economies because stock market trends DRIVE the economy (to a degree). This also explains why the perma-crowd that concentrate on bad economic statistics are looking in the WRONG place, they need to look at the stock charts that on average are up over 100%! So the stock market is up over 100% and is TRENDING higher which is acting as self fulfilling prophecy that will feed on itself all the way to the next bubble peak as more and more realise that they are missing out on what will probably turn out to be one the greatest bull markets in history which ignites the wealth effect amongst investors and speculators. Existing Stock Market Trend Expectations to be Tested
Given that the Dow over recent days has been gyrating around the psychologically important 14k level, therefore this is an opportune time for this detailed analysis to test the depth and breadth of a probable impending stock market correction. Perception of a Stocks Bull Market How should investors perceive a stocks bull market? It is not how so called analysts that pump out garbage promote which is in terms of looking for the final juncture. No, the only way one is going to profit from the stocks bull market is by perceiving it in terms of buying opportunities which is that the greater the deviation from the high the greater the buying opportunity presented. Conversely the stronger the bull run underway the less of a buying opportunity presented and the greater the probability of a correction. This is contrary to the psychology of virtually everything you are exposed to by so called analysts. You may still ask when will it end ? My simple answer is the end comes when the fools who have been bearish all along turn BULLISH! The end comes when everyone is talking stocks, buying garbage stocks as they did in the run up to the dot com bubble peak. When the end comes, it will make itself known many months if not near a year in advance! Stock Market Broadening Top Pattern Meets the Inflation Mega-trend The Dow having successfully breached the psychologically important 14k on Friday, an event that has triggered the mainstream media to busily dig out long-term charts for analysis that show that the market is approaching a multi-year high that is coupled with dubious concluding implications. What do you see when you look at the long-term Dow Chart?
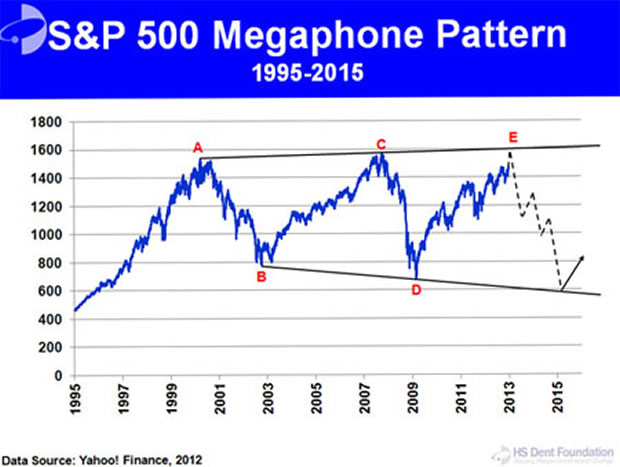
The consensus view as illustrated by popular market commentators such as Harry Dent, is that the price action resembles that of an broadening stock market megaphone pattern which implies that a severe bear market imminent as illustrated below from Harry's recent article - Harry Dent: Stock Market Roller Coasters and Bear Megaphones
Looking at the same chart through my own perception which is born out of pain and gain rather than academia or journalism. I see two key things, first a series of clearly defined trending significant bull and bear markets that collectively comprise a high volatility trading range, so the market has been exhibiting high volatility.
And secondly an 15 year exponential inflation and technologically wealth creating coiled spring that is ultimately being primed to propel the stock market to the next higher equilibrium level, just as occurred during previous similar periods such as the 1930's and 1970's. Whilst I don't see it as my job to analyse the performance of other market analysts. However, as we have convergence of interests here in which respect Harry Dent forecasts that the stock market rally will fizzle out during January and the stock market will likely crash by 30% to 50% (see Bloomberg video). Only one problem - The video's dated 31st Dec 2011 and the forecasts are for 2012! "I think the S&P 500 Is going to go down 30% to 50% in 2012 alone and I don't think that will be the bottom. This is going to be a replay of 2008 to early 2009 over the next year or two.".... Harry Dent - 31st Dec 2011. The message of this analysis is that of building upward inflationary pressure that stocks are leveraged to, and that increased volatility has made the stock market less susceptible to speculative interest, i.e. the stock market is perceived as being far more risky as investors viewing the market today perceive it in terms of the preceding 2 peaks and the subsequent deep troughs, then if it had slowly trended from 6000 to 14000 during the past 15 years, which fits the bill for a stealth bull market that is likely to stealthily break to and build on new highs. At this point the market has one of two possibilities - 1. Remain within the trading range (plus/ minus a few hundred points) and target a severe bear market. 2. Break the last high and target a new sustained bull market phase far beyond of that which can be perceived at this point in time. In my opinion the 2nd outcome is by far the most probable as a consequence of time, i.e. the longer the sideways trend then the greater the probability for a breakout inline with the expectations born of an exponential inflationary mega-trend and dissipation of speculative interest due to perceived uncertainty inherent in the mega-trend price pattern i.e. the price pattern of the past 15 years is inherently UNSTABLE - This instability breeds STABILITY ! Because the more certain a trend is the LESS likely is it to transpire. Instead as in my chart above shows that if the Dow had trended in a smooth trend to 14k then that would be inherently UNSTABLE for a speculative markets because most of the people CANNOT be right most of the time! The bottom line is that you do not want to see very stable price patterns for the stock or any other speculative market. You want the pattern to be marginal to be near 50/50, because most people tend to opt for what is easiest to perceive, much as everyone experiences gravity that pulls everything down to the ground, but instead what everyone fails to comprehend (including scientists) is that gravity is pushing everything away from everything else which is THE universal mega-trend - INFLATION and not just that but that the Inflation Mega-trend is EXPONENTIAL! Yes, I know, we will have to wait for Einstein's theory of relativity to be debunked at some future date, but the Universe is expanding in all directions (Big Bang origins), which suggests that we do not fully understand the nature of Gravity, what is a pulling force in our plane of existence, is a pushing force on other scales of existence. If you think this is nonsense, then ponder that the academic scientists believe that most of the matter in the universe is dark matter that they just cannot see or measure, it is what they use to confirm the inter-galactic behaviour they observe. Instead rather than dark matter it is more probable that gravity pushes as well pulls! Concerning Inflation, I won't repeat what I have written to near infinite length before, just let the below graph speak for itself.
This also explains why academic economists will always get it wrong because they always perceive their data in terms of smooth certainty i.e. that the economy will grow by 2% this year, 2.5% next, 3% third year, or as the Bank of England often repeats that Inflation will converge to 2% in 2 years time - Which NEVER HAPPENS! Because they have no concept of how trends actually work, if they did they would realise that the smooth certainty of their implied forecasts virtually guarantees that it will FAIL. Instead seek to evaluate the most extreme probabilities of outcomes, to arrive at the most probable and not the smooth curve fits. The same holds true for trading, the more extreme the price action the more valuable it is in terms of profit - See the real secrets for successful trading. Stocks Annual Percentage Change
Despite a 4 year bull run, the stock market when compared to preceding bull markets is clearly not over extended, at worst this graph suggests that the Dow on an annual closing basis has at least a further 10% to run, that is as a worst case. So there is no sign on this graph for an end to the stocks stealth bull market during 2013. Stock Market Elliott Wave Theory Analysis - Semper Terminus The near 4 year old stocks stealth bull market punches through resistance at Dow 14,000 and S&P 1500 for the first time since October 2007, with the Dow closing at 14,009 and the S&P at 1513. What happened to the final fifth ? According to the most ardent or rather vocal adherents of Elliott Wave Theory the stock market should have peaked over 3 years ago ! Sept - Oct 2009, then again peaked several times during 2010, then some more times in 2011, how many final peaks were there in 2012?, and as for January 2013? Yeah you guessed the END IS STILL ALWAYS NIGH! As Elliott Wave Theory is highly seductive in nature in that it gives analysts over confidence in future projections, therefore it is important that I share an excerpt from the March 2011 Stocks Stealth Bull Market Ebook ahead of my interpretation of the current wave patterns.
The Dangers of Being Seduced by Elliott Wave Theory Now, despite my interpretation of Elliot Wave analysis having proved highly accurate both before and since the March 2009 low and the above also very convincing on where the Dow could trend during 2011. However, before you start thinking that EWT maybe the 'holy grail' of analysis, take note that EWT Analysis on its own is just ONE component, and therefore one should not let oneself become seduced by what is highly seductive in the ease to which multiple junctures can be extended into the far distant future, which is how the highly public self professed Elliott Wave Gurus like it to be seen to be, though many of whom have apparently missed THE WHOLE STOCKS BULL MARKET as they continue to call one of the greatest bull markets in history a Bear Market rally and thus suffer from a case of permanent amnesia! which should send anyone's alarm bells ringing! Therefore Elliott Wave Theory, whilst continuing to strongly imply a bull run is expected to continue into end of 2011, however on it's own, in the long-run it is NOT going to be more accurate than a coin toss! The conclusions no matter how convincing of ANY single Component tool NEED to be confirmed by other fundamental and Technical analysis so as to arrive at a probable final conclusion rather than that which is perpetuated by EWT fanatics that have long since left reality behind them as evidenced by the fact that they still put their names to the worthless banner of a stocks "Bear Market Rally" that is anything but, under any rational measure. Therefore despite EWT being a useful tool, I am ALWAYS on guard against being seduced by EWT as it is extremely easy to back fit onto what has already happened to imply something highly probable is about to take place when the complete opposite may be true. So yes, whilst it's implications can get the adrenaline pumping and one eager to hit the TRADE button! I do have to take deep breaths and remember that there are NO short cuts! NO matter how enticing it appears, on its own EWT in the long-run WILL NOT be more accurate than COIN TOSS ! So, always keep in your mind that the EWT component Equates to a Coin Toss Over the Long-run and you won't become seduced and end up missing whole bull markets as MANY so called MASTER ELLIOTTITIONS have proceed to do ! Because they believe their own hype, much as gannophiles have been seduced by the master price time squares that is yet again another example of coin flip analysis elevated to 'holy grail' high priesthood status so as to perpetuate myths along the same lines that religious myths of so called revelations are perpetuated to fit in hindsight any subsequent event! When in reality EWT's true purpose should be to skew ones perception of the price action thus enabling an unbiased and always skeptical analysts to interpret price action from another perspective as part of a broader whole, even this will not guarantee success because analysis and trading boils down to probabilities and NOT certainties of outcome. Elliott Wave Theory - Impulse Waves The impulse trend elliott wave pattern chart suggests that the stock market is converging towards a 5th wave peak. Given the length of Impulse waves 1 and 3 this implies a peak between Mid March and Mid May 2013. With this trend targeting a range of Dow 14,300 to 14,500.
The implications are clear that following a 5th wave peak (unless it morphs into a 7th wave extension, with elliott wave you never know until after the fact!) That the stock market looks set to have a significant correction that is likely to exceed the size of Wave 2 and wave 4 corrections, i.e. more than 1000 Points, suggesting an ultimate decline of approx 1,500 off of the Peak. So a 14,500 peak would imply 13000. Elliott Waves - Sub Impulse Zooming in implies we are in sub impulse wave 3 that should end imminently. However the more important implication is for a bullish trend towards 14,300 to 14,500 by Mid to late March 2013.
Elliott Waves - The Bull Market Zooming way out of the chart shows that our five wave pattern is actually part of a larger 5 wave pattern that is also set to terminate, i.e. a 5th of a 5th. This acts to increase the order of magnitude for the subsequent correction for now it implies that this years stock market high will subsequently seek to correct the whole bull market trend from the March 2009 low. Again using the size of Wave 2 and Wave 4 as a minimum guide this suggests a decline of at least 2,000 points during a multi-month correction. In reality the implied correction could extend as far as 3000 points, i.e. to just below Impulse 2.
Elliott Wave Conclusion - The wave patterns appear pretty clear in that they do portent for a significant stock market correction this year on termination of the current rally that will at the very least retrace the WHOLE of the current rally, that's back down to BELOW 12,500 and probably extend to below 12,000. Elliot Wave Implied Fantasy Pattern On the basis of the probable simple pattern being for a 5th of a 5th, then this analysis further concludes that the termination point for the 5th of a 5th is a Larger Wave 1 and therefore implies a further 2 Larger Impulse waves 3 and 5 as the following graph illustrates -
Now don't take this as a forecast because it is way beyond what probability analysis can ever give confidence to, instead treat it as an indication that whilst stocks into mid year may look sickly in the broader context the move would be very healthy by setting the stage for the stocks bull market's next multi-year bull run. Remember that the over-riding driver is the Inflation mega-trend to which stocks are leveraged, and the risk that the world constantly faces is not one of deflation but one of out of control inflation both as a consequence of rampant government money printing and as a consequences of any breakdown in our systems. For instance the crisis in Greece contrary to the economic academics did not result in deflation, instead it resulted in Inflation, because economic collapse results in the destruction of productive capacity, which results in the state forced to print money to pay the increasing number of unemployed workers. Stock Market Psychology and Investor Sentiment Market sentiment is usually in synch with the mainstream media, which at this point in time should suggest that it should be at its most bullish in the face of the ongoing swing towards NEW All Time highs for indices such as the Dow. The psychological influences that investors tend to be exposed to is illustrated by how so called analysts tend to commentate on market trends which tends to be bearish AFTER the market has already fallen and Bullish AFTER the market has risen. i.e. many of the commentators who are so bullish today could easily be found to have been vehemently bearish towards the END of virtually every major correction for the duration of this stocks bull market. So without analysing the analysts, I am pretty certain that after leaving the perma-bears aside that investor sentiment will be at a bullish extreme, which requires a contrary trend to dissipate such sentiment. In terms forecasting trend, this suggests that the market has been in the process of hooking more investors towards the extremity of price action before it pulls the rug from under their feet. Technically this implies the market is priming itself for an opportune moment for a significant correction. which implies risk management is in order i.e. distribute portfolios further into this rally or hedge (my preference is for hedging because, in my opinion dividend income is the most important long-term driver for both income and stock price growth). In terms of the big picture the stocks stealth bull market will continue to accumulate more and more investors towards rally peaks as rising stock prices results in ever increasing investor sentiment which will confound the perma-bears who will always see high investor sentiment as a sign of the FINAL TOP, but what they are blind to is the fact that NEW HIGHs WILL Mean NEW Higher levels of Investor sentiment, which to them will always be a sign of extremes, but in reality it is just a manifestation of TREND. The bull market is not an oscillator it is a Trend that is converging towards a state of extreme over valuation, which is when the actual top will take place, when? I will let you know when probably a year in advance, but not likely in 2013. Stock Market Volatility - VIX Recent stock market volatility has been nudging multi-year lows that implies a great deal of investor complacency out there.
The VIX coupled with the actual immediate trend is clearly distributive as it can be directly compared against the Sept-Oct distribution that was accompanied with rising volatility from the Mid Sept low. This does suggest that a correction is imminent and given extremely low volatility the correction will likely be very significant in both time and price. Another point to consider low volatility translates into cheap options!
MACD - Just as the VIX is has been at multi-year lows so has the MACD been at multi-year highs. The MACD has already crossed which is an advance sell signal. Therefore the MACD is clearly warning of at least an imminent regular Impulse correction. Price Patterns - Apart from the broadening top pattern that I have already covered earlier. I do not see any thing else of any significance. SEASONAL ANALYSIS The current trend is contrary to the seasonal tendency for the stock market to fall from early January into mid March, which suggests an inverse probability i.e. a rise into Mid March would imply a fall into Mid May, before a volatile summer resets the seasonal pattern back inline for expectations for a rally during the last 2-3 months of the year. The smoothed trend for the stock market would be for a rally into early June, sideways into Mid October and then a rally into year end. This at least points towards an end year rally, whilst probability favours an inverse pattern into a Mid May low and then another low between August and October. TREND ANALYSIS - The current rally has hit or even marginally breached the resistance line along the highs. This is putting the rally under intense pressure that warrants an imminent correction of sorts to dissipate this trend pressure. Whilst upside appears limited the stock market has plenty of support under it that is more than capable of slowing a decent which implies a very choppy correction is likely with major support converging at 12,800 by mid April. In summary the Dow is trading in a strong upward sloping trend channel that is likely to contain 90% of the price action during the year. SUPPORT / RESISTANCE - Resistance lies at the all time high of 14,164 that it hit on 9th Oct 2007, that is on par with my long-term target of 14,200. Therefore the Dow IS now at Significant resistance that requires a sizeable correction to overcome. A String of support levels range all the way to 12,500, which if fails would target 12,000. PRICE TARGETS - The immediate target is a high in the range of 14,100 to 14,200. The Dow has already traded to 14,022, so a high is imminent. A correction targets 13,600, then 13,000, then 12,500 and finally 12,000. Formulating a Stock Market Forecast
Stock Market Trend Forecast Conclusion The stock market wants to trade at a new all time high (14,164) and is fighting hard to do so against strong technical resistance that call for an increasingly severe correction. Therefore I am timing the correction to begin after the New All time high, though in reality it could take place at anytime. The quality of the correction will likely be severe and extend for several months into late Summer that would set the scene for an strong end of year rally that will likely carry the Stock market to a new all time high. At this point the analysis resolves to a new high of around 14,500. In summary this analysis concludes in a detailed trend forecast for the Dow to target a correction into Late Summer of 12,500 to be followed by a strong trend to a new all time high of 14,500 probably during Early January 2014, as illustrated by the below graph.
Risk to the Forecast That the rally following the significant correction needs more time to complete, i.e. the 14,500 target is achieved later during 2014. Peering into the Mists of Time If you have actually read the whole of this analysis (rather than just skipping to the conclusion) then the message you will get is one of an ongoing stocks bull market that like a coiled spring is prepping itself to propel the stock market to levels that cannot be imagined today I.e. my Elliott Wave and broadening top analysis gives strong indications for longer-term expectations. I can easily see the Dow trade at 20,000 during 2017, so expect plenty more Stocks Stealth Bull Market ebook's to follow. Stocks Stealth Bull Market Update 2013 - Ebook
Ensure you are subscribed to my always free newsletter for the FREE DOWNLOAD. Your the trend is your friend analyst reminding you of where the bull market began.... Stealth Bull Market Follows Stocks Bear Market Bottom at Dow 6,470... The stock market is now up 116%. Source and Comments: http://www.marketoracle.co.uk/Article38931.html Nadeem Walayat Copyright © 2005-2013 Marketoracle.co.uk (Market Oracle Ltd). All rights reserved. Nadeem Walayat has over 25 years experience of trading derivatives, portfolio management and analysing the financial markets, including one of few who both anticipated and Beat the 1987 Crash. Nadeem's forward looking analysis focuses on UK inflation, economy, interest rates and housing market. He is the author of three ebook's - The Inflation Mega-Trend; The Interest Rate Mega-Trend and The Stocks Stealth Bull Market Update 2011 that can be downloaded for Free.
Disclaimer: The above is a matter of opinion provided for general information purposes only and is not intended as investment advice. Information and analysis above are derived from sources and utilising methods believed to be reliable, but we cannot accept responsibility for any trading losses you may incur as a result of this analysis. Individuals should consult with their personal financial advisors before engaging in any trading activities.
You're receiving this Email because you've registered with our website. How to Subscribe Click here to register and get our FREE Newsletter To access the Newsletter archive this link Forward a Message to Someone [FORWARD] To update your preferences [PREFERENCES] How to Unsubscribe - [UNSUBSCRIBE]
The Market Oracle is a FREE Financial Markets Forecasting & Analysis Newsletter and online publication. |
||||||||||||||


© 2005-2022 http://www.MarketOracle.co.uk - The Market Oracle is a FREE Daily Financial Markets Analysis & Forecasting online publication.