UK House Prices Soar to New All Time High, London Bubble, Nationwide Data
Housing-Market / UK Housing Jul 02, 2014 - 02:32 PM GMTBy: Nadeem_Walayat
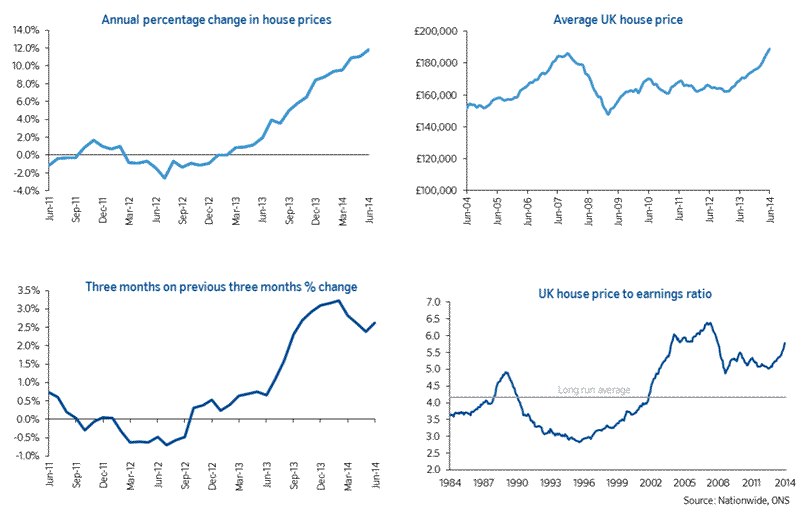
 The Nationwide released their latest UK house price data for June 2014 that showed a 1% rise on the month lifting the annual rate to 11.8% and taking average UK house prices to a new all time high of £188,903. All UK regions saw a rise in house prices with the South East continuing to outperform and London's bubble market hitting an raging hout annual price rise of 26%.
The Nationwide's chief economist, Robert Gardner, commented:
“House prices recorded their fourteenth successive monthly increase in June, rising by 1%. As a result, the annual pace of price growth picked up to 11.8% from 11.1% the previous month.
“In seasonally adjusted terms house prices reached their 2007 peak in Q2, just as UK economic output is likely to have surpassed the high water mark reached before the financial crisis.
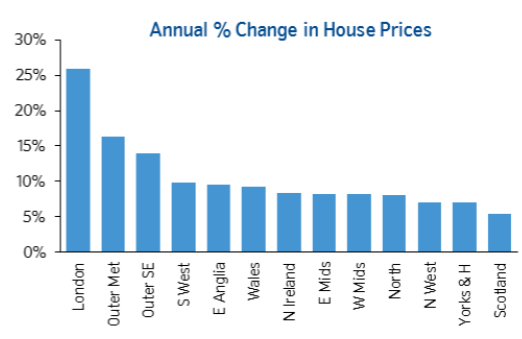
“While all regions recorded annual price gains for the fourth quarter in a row, there is still significant variation across the UK, with the South of England continuing to record the strongest rates of growth. In particular, London continued to outperform, with prices up by almost 26% in Q2 compared to the same period of 2013.
“The price of a typical property in London reached the £400,000 mark for the first time, with prices in the capital now around 30% above their 2007 highs and more than twice the level prevailing in the rest of the UK when London is excluded. In the UK as a whole, prices are less than 1% above their pre-crisis peak. Excluding London they are 0.4% below peak.
“The annual pace of growth in the capital will probably start to slow in the quarters ahead, given the high base for comparison from Q3 2013 onwards and given anecdotal evidence from surveyors and estate agents that activity may be starting to moderate.
London House Prices Bubble
The London house pries bubble continues to inflate at the rate of 26% per annum.
Robert Gardener comments:
“The price of a typical UK house rose by 2.9% in Q2, after allowing for seasonal effects. Prices were up 11.5% compared with the same quarter of 2013.
“Annual house price growth accelerated to 26% in London, far outpacing the rest of country, and the highest growth rate since Q3 1987. Prices in the capital are now 30% above their 2007 peak, with the price of a typical London property now in excess of £400,000.
“Scotland saw the weakest growth, with prices up 5.4% year-on-year in Q2. Northern Ireland saw an 8.4% rise in prices, although they remain around half the level they were at their peak. Annual price growth in Wales picked up to 9.3%, from 5.2% last quarter.
“Amongst the English regions, the South continued to outperform the North. Outside of London, the Outer Metropolitan area was again the strongest performing region, with annual price growth of 16.4%, whilst Yorkshire & Humberside was the weakest English region, with prices up 7.0% over the year. Prices in the Southern regions are now above their 2007 peak, whilst those in the North remain below.”
Meanwhile the more widely followed Halifax house prices index continues to trend towards breaking to its new all time high before the end of this year.
UK House Prices Five Year Forecast
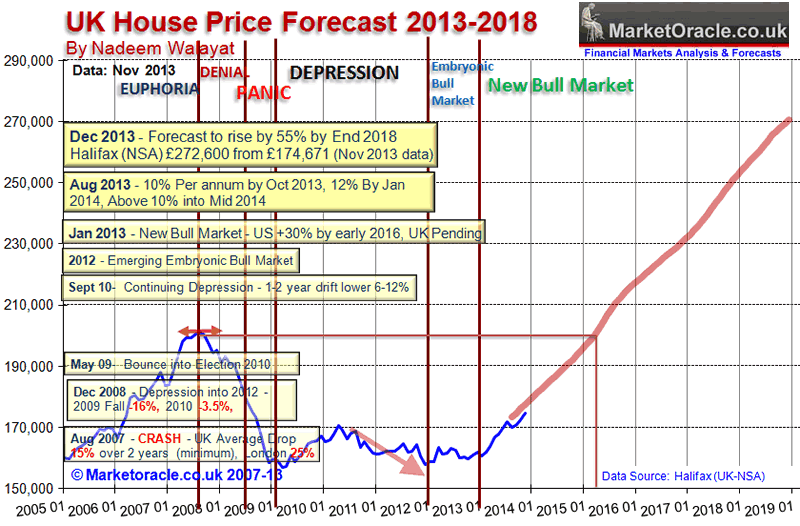
The most recent house prices data out of the Halifax is inline with expectations for a forecast 55% rise by the end of 2018 as illustrated below -
UK House Prices Forecast 2014 to 2018 - Conclusion
This forecast is based on the non seasonally adjusted Halifax House prices index that I have been tracking for over 25 years. The current house prices index for November 2013 is 174,671, with the starting point for the house prices forecast being my interim forecast as of July 2013 and its existing trend forecast into Mid 2014 of 187,000. Therefore this house prices forecast seeks to extend the existing forecast from Mid 2014 into the end of 2018 i.e. for 5 full years forward.
My concluding UK house prices forecast is for the Halifax NSA house prices index to target a trend to an average price of £270,600 by the end of 2018 which represents a 55% price rise on the most recent Halifax house prices data £174,671, that will make the the great bear market of 2008-2009 appear as a mere blip on the charts as the following forecast trend trajectory chart illustrates:
Current State of the UK House Prices Forecast
The updated graph reflects the latest Halifax house prices data (NSA) released for May 2014 at £185,747 which is set against the forecast index level for May 2014 of £185,544 which illustrates that house prices over the past 6 months have shown little deviation from the forecast trend and therefore the long-term trend forecast remains on track to achieve a 55% increase by the end of 2018.
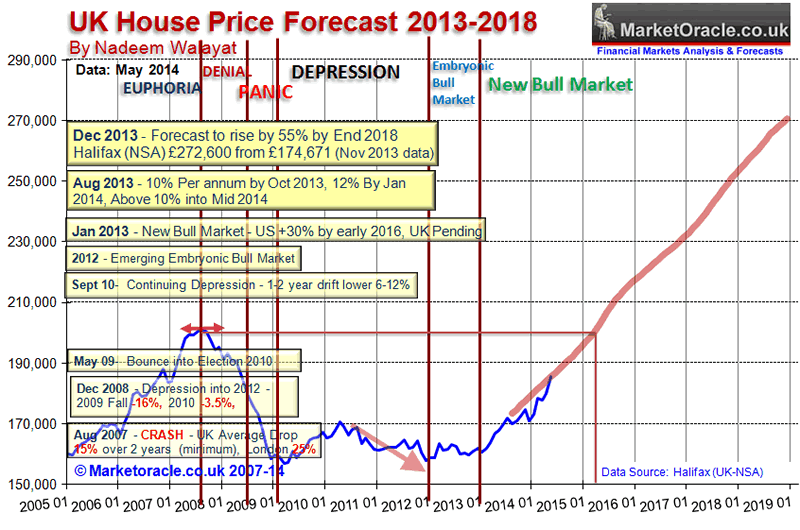
As house prices momentum is accelerating this suggests that UK house prices could trend slightly above the forecast trend trajectory over the summer months which would match the Nationwide's acceleration to 11.8%.
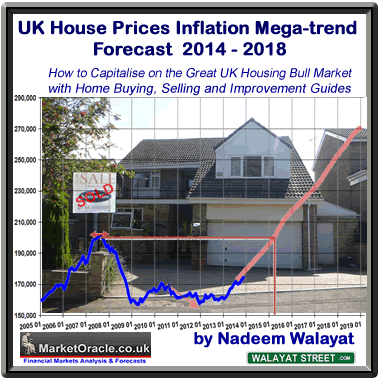 UK Housing Market Forecast 2014-2018 Ebook - FREE DOWNLOAD
The housing market ebook of over 300 pages comprises four main parts :
1. U.S. Housing Market Analysis and Trend Forecast 2013-2016 - 27 pages
The US housing market analysis and concluding trend forecast at the start of 2013 acted as a good lead exercise for the subsequent more in-depth analysis of the UK housing market.
2. U.K. Housing Market Analysis and House Prices Forecast 2014-2018 - 107 pages
The second part comprises the bulk of analysis that concludes in several detailed trend forecasts including that for UK house prices from 2014 to 2018 and their implications for the outcome of the next General Election (May 2015) as well as the Scottish Referendum.
3. Housing Market Guides - 138 Pages
Over 1/3rd of the ebook comprises of extensive guides that cover virtually every aspect of the process of buying, selling and owning properties, including many value increasing home improvements continuing on in how to save on running and repair costs with timely maintenance tasks and even guides on which value losing home improvements should be avoided.
- What Can You Afford to Buy?
- Home Buyers Guide
- Home Sellers Guide
- Top 15 Value Increasing Home Improvements
- Home Improvements to Avoid
- Home Winter Weather Proofing 22 Point Survey
These guides will further be supplemented from Mid 2014 onwards by a series of online videos and regularly updated calculators such as the Home Buying Profit and Loss Calculator, which will seek to give calculations on whether to buy or rent based on personal individual circumstances, that will be updated to include the latest expected trend trajectories for future house price inflation i.e. you will have your own personal house price forecast.
4. Historic Analysis 2007 to 2012 - 40 pages
A selection of 10 historic articles of analysis to illustrate the process of analysis during key stages of the housing markets trend from the euphoric bubble high, to a state of denial as house prices entered a literal free fall, to the depths of depression and then emergence of the embryonic bull market during 2012 that gave birth to the bull market proper of 2013.
FREE DOWNLOAD (Only requirement is a valid email address)
Source and comments: http://www.marketoracle.co.uk/Article46294.html
By Nadeem Walayat
Copyright © 2005-2014 Marketoracle.co.uk (Market Oracle Ltd). All rights reserved.
Nadeem Walayat has over 25 years experience of trading derivatives, portfolio management and analysing the financial markets, including one of few who both anticipated and Beat the 1987 Crash. Nadeem's forward looking analysis focuses on UK inflation, economy, interest rates and housing market. He is the author of five ebook's in the The Inflation Mega-Trend and Stocks Stealth Bull Market series that can be downloaded for Free.
 Nadeem is the Editor of The Market Oracle, a FREE Daily Financial Markets Analysis & Forecasting online publication that presents in-depth analysis from over 1000 experienced analysts on a range of views of the probable direction of the financial markets, thus enabling our readers to arrive at an informed opinion on future market direction. http://www.marketoracle.co.uk
Disclaimer: The above is a matter of opinion provided for general information purposes only and is not intended as investment advice. Information and analysis above are derived from sources and utilising methods believed to be reliable, but we cannot accept responsibility for any trading losses you may incur as a result of this analysis. Individuals should consult with their personal financial advisors before engaging in any trading activities.
Nadeem Walayat Archive |
© 2005-2022 http://www.MarketOracle.co.uk - The Market Oracle is a FREE Daily Financial Markets Analysis & Forecasting online publication.


