


US Dollar Forecast to Go Much Higher
Currencies / US Dollar Sep 15, 2014 - 11:45 AM GMTBy: David_Petch

 The US Dollar has gone gang busters after breaking above 81.7 and clearly has broken out. This has implications for everything else. As the US Dollar is a Reserve Currency, everything that has an inverse relationship to it will fall, such as gold. As I mentioned, I got out of all of my core precious metal positions a few weeks ago after the drop and bounce, as there is no indication that they will participate to the upside with a rising US Dollar under the current global environment. Most commodities are experiencing weakness and this will continue into next year until the US Dollar initially tops out. When the global economy after August 2015 hits, then commodities could get whacked even more. They might not get clipped as bad as per 2008 off the record highs, but there still will be a correction to follow. How long the rally in the US Dollar lasts is really anyone's guess. Analysis will show a high expected in the range of 93-95 by August 2015, but it could still have strength as deflation overtakes the global economies.
The US Dollar has really been in the process of a bottom since 2008. During the recent sideways consolidation, a move below 78.4 would have implied a move down to 73.0 based upon the measured move of two head and shoulders patterns. A move above 81.7 invalidated this downside and reversed the downside energy to the upside. What could have been a midway downside pattern it the termination point and based upon that, the US Dollar could exhibit strength for at least 5 years, or as long as the most recent base. Analysis today technically addresses the above.
Currencies
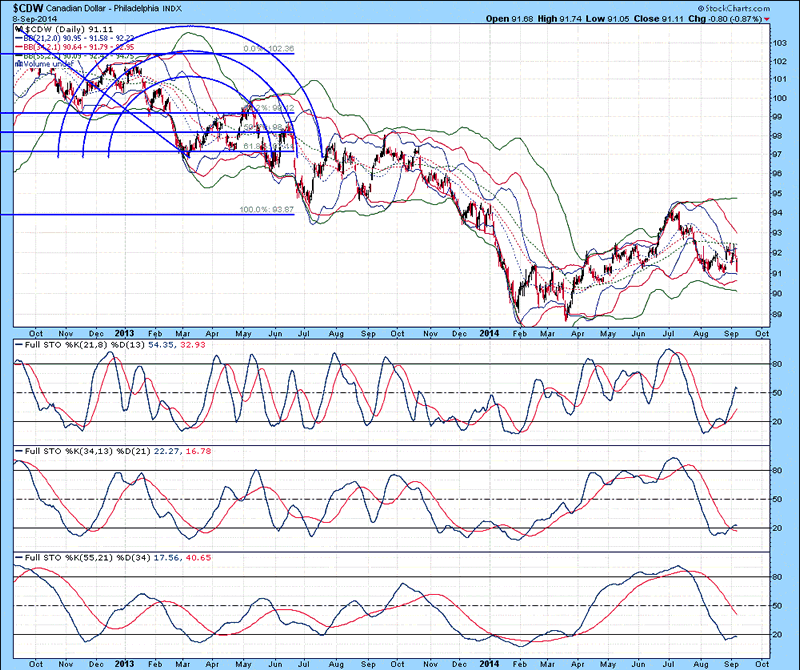
The first chart of the day is the daily of the Canadian Dollar Index. The Loonie got whacked hard yesterday and is in close proximity to the lower 21 and 34 MA Bollinger band that are curling down, strongly suggests that further lows are likely. Full stochastics 1, 2 and 3 are shown below in order of descent, with the %K above the %D in 1 and 2 and beneath the %D in 3. Although the %K in stochastics 1 and 2 are rising, they appear to be starting to curl down. There has been nothing but a series of lower highs, so based upon this, the move up for the first half of 2014 was likely a mid-way consolidation before another down leg occurs.
Figure 1
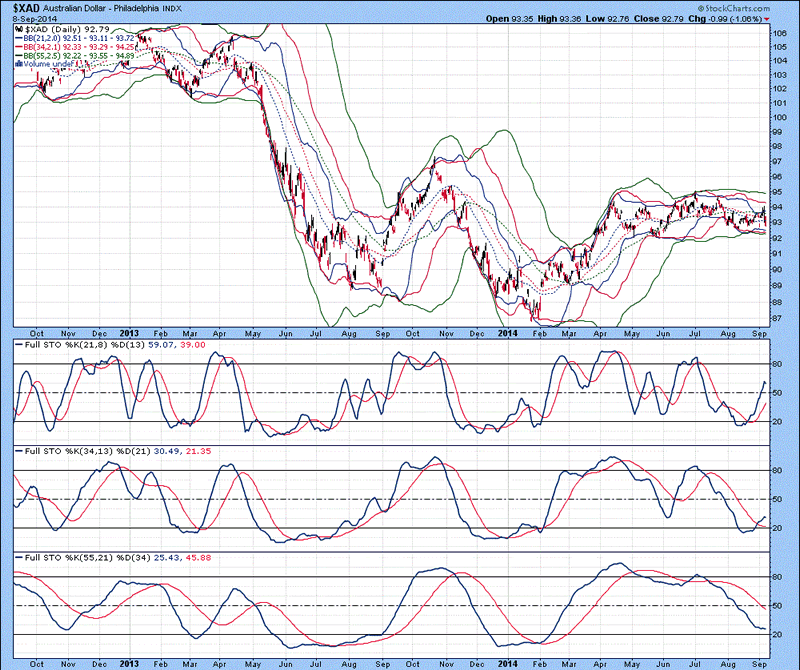
The daily chart of the Australian Dollar Index is shown below, with all three lower Bollinger bands in close proximity to each other. With known strength in the US Dollar Index, one has to be careful with the currency from down under. Although the basing pattern appears stronger than that of the Loonie, a weekly close below 92.0 would signal a reversal to the downside. Full stochastics 1, 2 and 3 are shown below, with the %K in 1 and 2 and above the %D in 3. With the %K in stochastics 1 and 2 starting to curl down, things could reverse in a hurry. One does not want to be too cute and try and trade lower Degree sub-minuette patterns, because this is a recipe for disaster. Invest in the trend, which is a rising US Dollar Index.
Figure 2
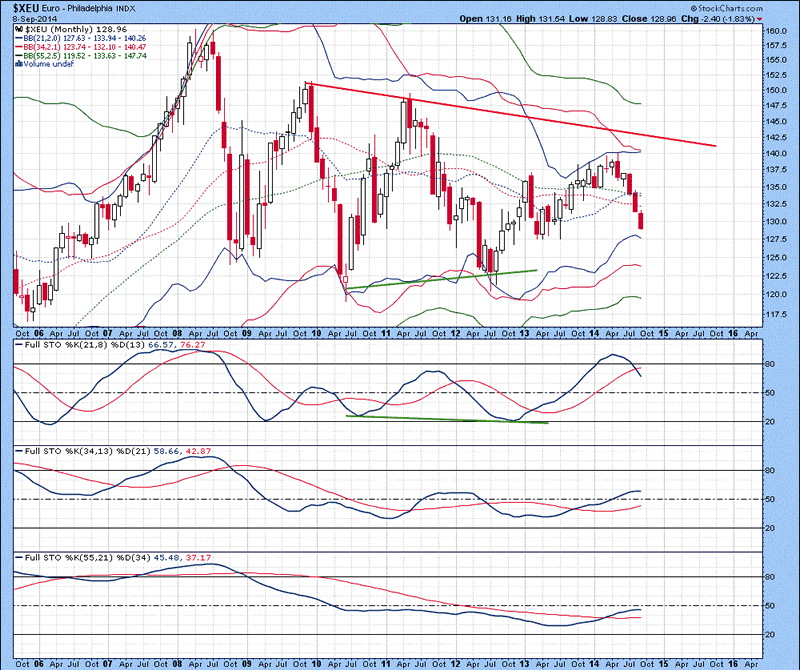
The monthly chart of the Euro Index is shown below, and if there was ever an ugly currency, this picture is worth a thousand words. All three lower Bollinger bands are curling down, which is a prelude to much lower values. Ever since 2008, there has been nothing but a series of lower highs, indicating that the past 6 years have merely been a consolidation. The longer the consolidation, the sharper the move to the upside or downside. In this case, the setup appears to be to the downside. If 124.5 is taken out, then it would signal a breakdown from the pattern, with the potential to decline to as low as parity. In the most extreme case 90 cents, but that would be an absolute demise of the Euro and I do not think the global markets would tolerate that. Look for 110 as a conservative bottom, but be aware that parity could hit and if it does, then the US will not be exporting anything but debt. Full stochastics 1, 2 and 3 are shown below in order of descent, with the %K beneath the %D in1 and above the %D in 2 and 3. With the %K in stochastic 1 curling down, this sort of trend on the monthly chart does not just reverse...it follows the trend to the end. Based upon this, a bottom in the Euro is not due until sometime between May and October 2015. This sounds like quite a gap for a bottom, but there are a lot of variables. The bottom line is that owning the Euro over the next 8-12 months is only going to result in a loss of purchasing power relative to the US Dollar Index. This is going to cause all of the people to go to the other side of the boat and with boats that do not have a balanced cargo...we all know what happens.
Figure 3
US Dollar Index
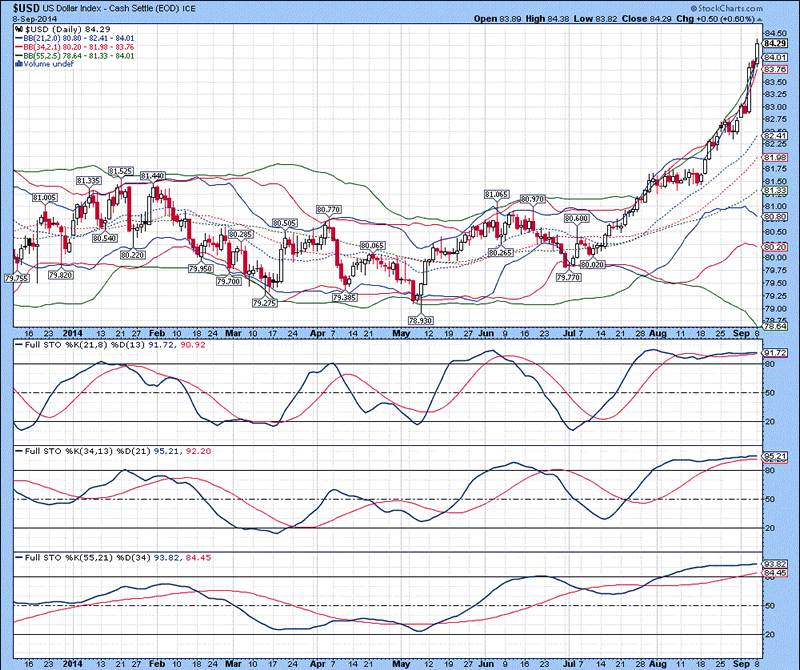
The daily chart of the US Dollar Index is shown below, with the upper 21 MA Bollinger band at a singularity with the 55 MA Bollinger band and above the 34 MA Bollinger band, indicates an overbought condition has occurred. To top this off, a price excursion above the price for three consecutive days strongly suggests a 1.5-2 cent correction is due. Look for a pullback to at least 82.50 and if this fails, then 81.50 is the next major level of support. All three lower Bollinger bands are still curling down and until they all curl up, a top will not occur. We could see the US Dollar continue to spiral higher for another 3-4 weeks before a top happens. People have to remember that the strength into the US Dollar over the next 9-12 months is going to be absolutely huge due to the number of global pension funds having to try and maintain that magic 7%/year return in order to have liquidity. This chasing will result in the demise of many pension funds after 2015 when the stock market goes into a 5 year decline. All three stochastics are at the upper end of their range, but again, lower Bollinger bands all curling down dictate the trend.
Figure 4
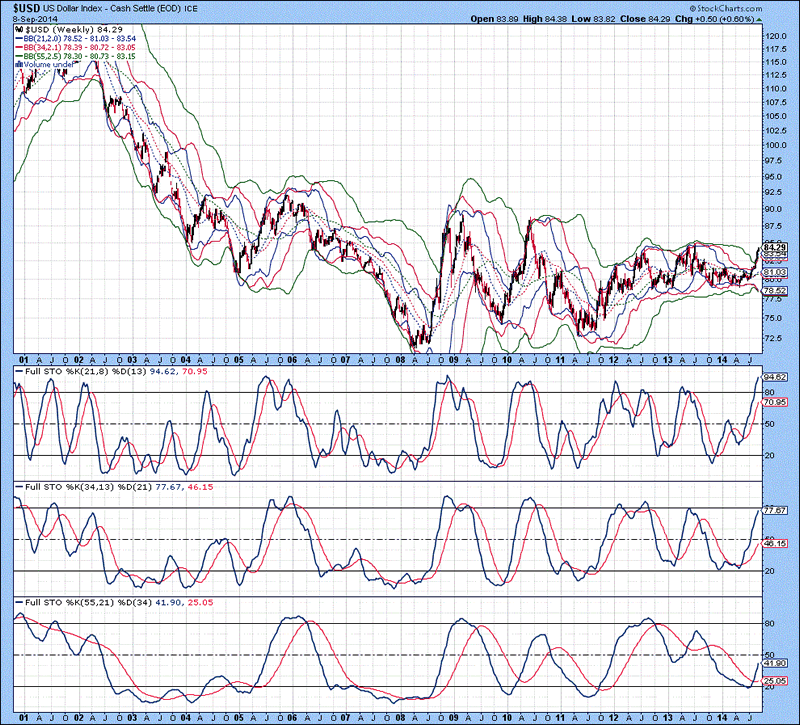
The weekly chart of the US Dollar Index is shown below, with the upper 21 MA Bollinger band above the 34 and 55 MA Bollinger bands indicates an overbought condition is developing. All three lower Bollinger bands are in close proximity to each other and are curling down automatically implies 9-12 months of upside strength. The US Dollar is about to become extremely overbought and many normal technical indicators are going to become non-telling. The best technical tool to navigate through this period will be to focus on the Bollinger bands. When the lower 55 MA Bollinger band curls up, it will indicate a top but as mentioned, this is at least 9-12 months out, based upon the historical amount of time Bollinger bands take to complete this sort of pattern. Full stochastics 1, 2 and 3 are shown below in order of descent, with the %K above the %D in all three instances. The %K in stochastic 3 only rose above the %D in July, so there is at least another 3-4 months of upside expected before any sort of significant pullback occurs.
Figure 5
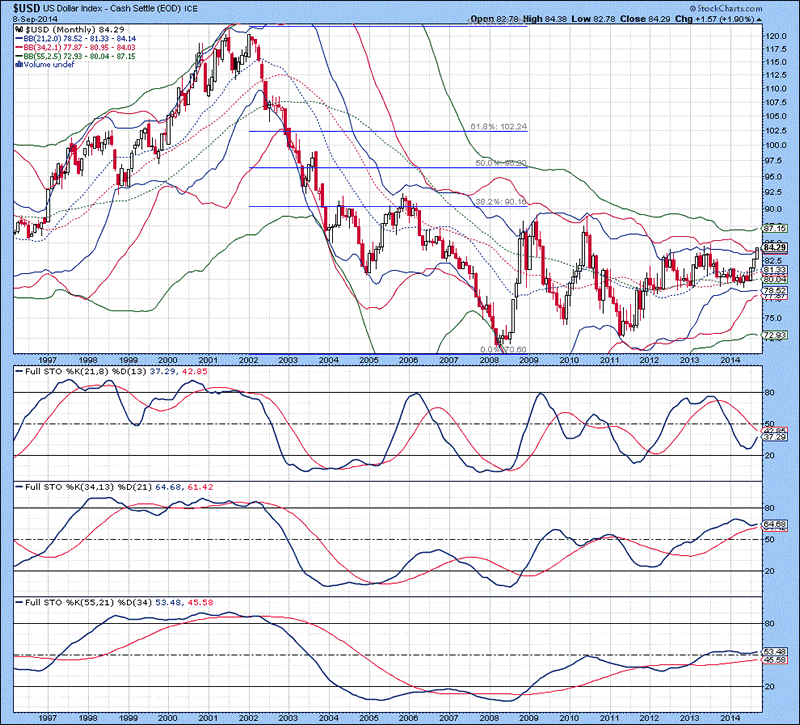
The monthly chart of the US Dollar Index is shown below, with the upper 21 MA Bollinger band above the 34 MA Bollinger band indicating an overbought condition is developing. Also, a minor price excursion above the 21 and 34 MA Bollinger bands suggests a 2-3 week pause is likely (also coupled to the overbought readings generated on the daily and weekly charts) before rising higher. Full stochastics 1, 2 and 3 are shown below in order of descent, with the %K beneath the %D in 1 and above the %D in 2 and 3. Notice how the %K in stochastic 1 has hooked up. The US Dollar Index has really been in a bottoming process over the past 9 years and failure to break lower has had all of the potential downside energy transferred into upside potential. As weird as this sounds, I think the US Dollar has the potential to be in a bull market for the next 3-5 years, as the longer the consolidation the longer the trend of the breakout to the upside or downside. The breakout above 81.70 was the nail in the coffin for the US Dollar Index breaking down, so now the trend is to the upside.
Figure 6
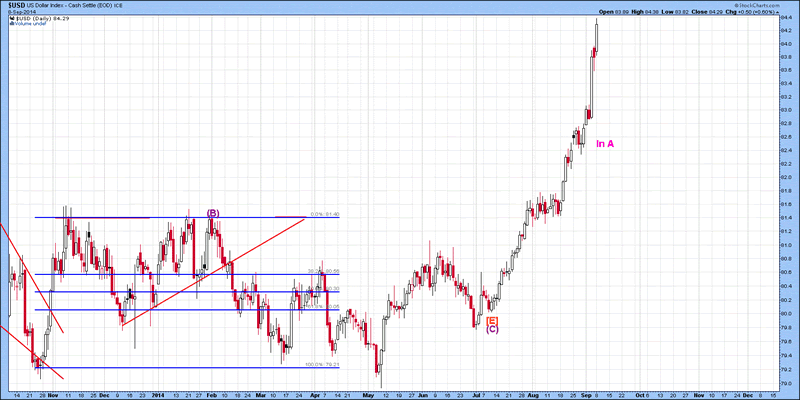
The short-term Elliott Wave count of the US Dollar Index is shown below, with wave [E] ending a long pattern and wave A underway as the start of another. Wave A really does have the look and "feel" of an impulsive pattern, so this thing at a minimum is a zigzag (5-3-5) or a larger impulsive pattern. If wave A or (A)...I have to get a feel for the correct Degree of labelling goes to 86.5-87.0, then the entire 5-3-5 pattern (A-B-C) will go to 93-95.0 by this time next year. The US Dollar is in a very bullish setup for the next 9-12 months...I cannot emphasize this enough.
Figure 7
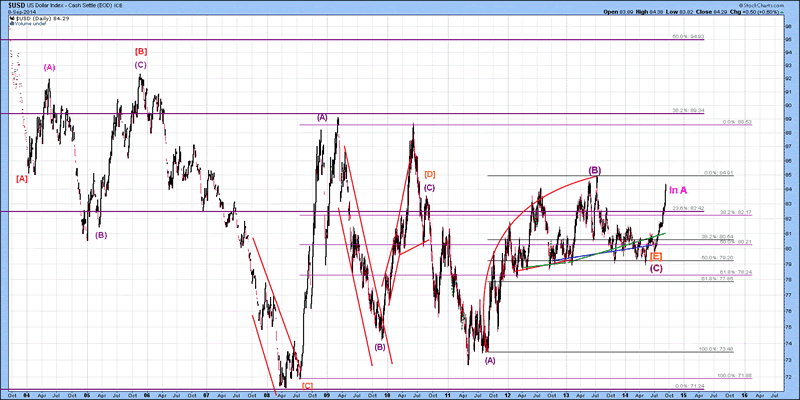
The mid-term Elliott Wave count of the US Dollar Index is shown below, with a bigger picture view of what happened from the Elliott Wave chart perspective. The US Dollar is off to the races, so any equity tied to the US Dollar is likely to rise, much like the tide lifting all boats. There will be a pullback at some point...if a zigzag is developing, then a 2-3 month pause (wave B should be equivalent or longer in time relative to wave A) before breaking higher. A huge top in the stock market is due around August next year, so enjoy it while it lasts.
Figure 8
That is all for today...
By David Petch
http://www.treasurechests.info
I generally try to write at least one editorial per week, although typically not as long as this one. At www.treasurechests.info , once per week (with updates if required), I track the Amex Gold BUGS Index, AMEX Oil Index, US Dollar Index, 10 Year US Treasury Index and the S&P 500 Index using various forms of technical analysis, including Elliott Wave. Captain Hook the site proprietor writes 2-3 articles per week on the “big picture” by tying in recent market action with numerous index ratios, money supply, COT positions etc. We also cover some 60 plus stocks in the precious metals, energy and base metals categories (with a focus on stocks around our provinces).
With the above being just one example of how we go about identifying value for investors, if this is the kind of analysis you are looking for we invite you to visit our site and discover more about how our service can further aid in achieving your financial goals. In this regard, whether it's top down macro-analysis designed to assist in opinion shaping and investment policy, or analysis on specific opportunities in the precious metals and energy sectors believed to possess exceptional value, like mindedly at Treasure Chests we in turn strive to provide the best value possible. So again, pay us a visit and discover why a small investment on your part could pay you handsome rewards in the not too distant future.
And of course if you have any questions, comments, or criticisms regarding the above, please feel free to drop us a line . We very much enjoy hearing from you on these items.
Disclaimer: The above is a matter of opinion and is not intended as investment advice. Information and analysis above are derived from sources and utilizing methods believed reliable, but we cannot accept responsibility for any trading losses you may incur as a result of this analysis. Comments within the text should not be construed as specific recommendations to buy or sell securities. Individuals should consult with their broker and personal financial advisors before engaging in any trading activities as we are not registered brokers or advisors. Certain statements included herein may constitute "forward-looking statements" with the meaning of certain securities legislative measures. Such forward-looking statements involve known and unknown risks, uncertainties and other factors that may cause the actual results, performance or achievements of the above mentioned companies, and / or industry results, to be materially different from any future results, performance or achievements expressed or implied by such forward-looking statements. Do your own due diligence.
Copyright © 2014 treasurechests.info Inc. All rights reserved.
Unless otherwise indicated, all materials on these pages are copyrighted by treasurechests.info Inc. No part of these pages, either text or image may be used for any purpose other than personal use. Therefore, reproduction, modification, storage in a retrieval system or retransmission, in any form or by any means, electronic, mechanical or otherwise, for reasons other than personal use, is strictly prohibited without prior written permission.
David Petch Archive |
© 2005-2022 http://www.MarketOracle.co.uk - The Market Oracle is a FREE Daily Financial Markets Analysis & Forecasting online publication.