


Stock Market Secular Cycles
Stock-Markets / Stock Markets 2014 Nov 07, 2014 - 01:59 PM GMTBy: Donald_W_Dony

 Many investors and analysts are expecting a resurgence in commodity prices. Yet a review of historical data would suggest that the current movement in natural resource prices, the US$, stock markets and the business cycle are all part of a well-defined pattern.
The relative performance between commodities and stocks, based on a 135 years of data, indicates that the two asset classes shift in leadership on average about every 18 years.
In Chart 1, we see the S&P 500 over the last 50 years. The periods of time (1965-1979, 2000-2012) when commodities outperformed the S&P 500, it created an extended consolidation for the US stock index.
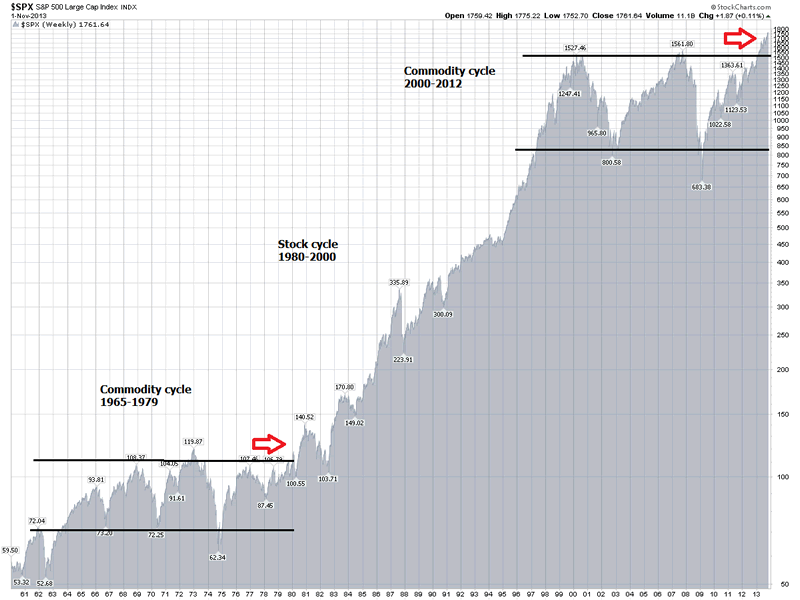
When stocks (S&P 500) outperformed commodities (1950-1965, 1980-2000, 2012 to present), an extended period of growth developed for the S&P 500.
Some of the principal characteristics of a secular commodity cycles are increased volatility, deeper and longer corrections, downward trending US$, shorter business and stock market cycles.
Some of the principal characteristics of a secular stock cycles are lower volatility, shallow and short duration corrections, an upward trending US$ and extended business and stock market cycles.
For commodities, one of the prime elements that dictates price direction, is the U.S. dollar. As natural resources are priced in US$, a rising dollar makes commodities more expensive.
Chart 2 illustrates the impact on commodity prices in an environment with an escalating dollar.
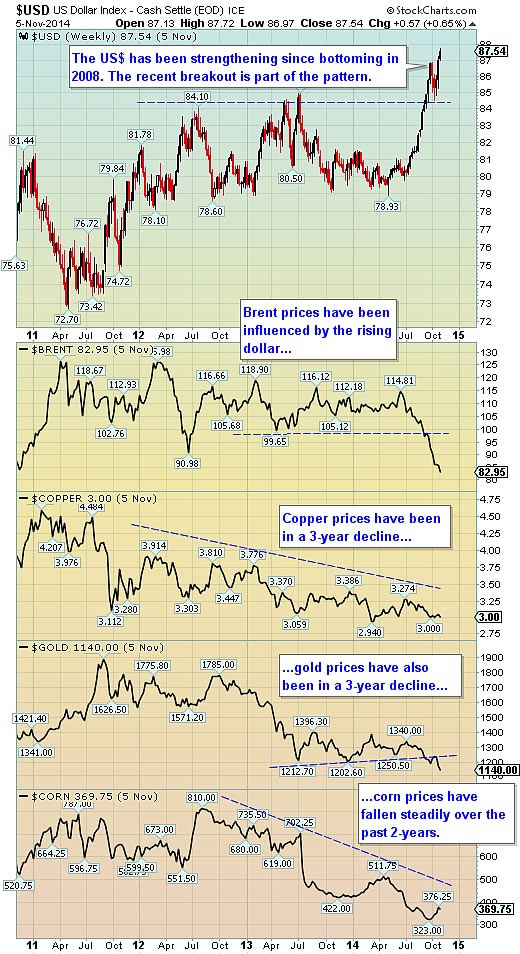
For example, from 2011, brent is down 36%, copper is off 35%,
gold has dropped 40% and corn has declined by 55%.
Bottom line: Secular stock and commodity cycles last, on average, about 18 years. The current cycle is a stock cycle (S&P 500). This means that, based on 135 years of data, stocks (S&P 500) should outperform commodities for about the next 15 years. This cycle started in 2012/13.
Investment approach: With the evidence pointing toward a prolonged stock (S&P 500) cycle, we would suggest lowering commodity positions on any counter-trend rallies and focusing on non-commodity sectors.
By Donald W. Dony, FCSI, MFTA
www.technicalspeculator.com
COPYRIGHT © 2014 Donald W. Dony
Donald W. Dony, FCSI, MFTA has been in the investment profession for over 20 years, first as a stock broker in the mid 1980's and then as the principal of D. W. Dony and Associates Inc., a financial consulting firm to present. He is the editor and publisher of the Technical Speculator, a monthly international investment newsletter, which specializes in major world equity markets, currencies, bonds and interest rates as well as the precious metals markets.
Donald is also an instructor for the Canadian Securities Institute (CSI). He is often called upon to design technical analysis training programs and to provide teaching to industry professionals on technical analysis at many of Canada's leading brokerage firms. He is a respected specialist in the area of intermarket and cycle analysis and a frequent speaker at investment conferences.
Mr. Dony is a member of the Canadian Society of Technical Analysts (CSTA) and the International Federation of Technical Analysts (IFTA).
Donald W. Dony Archive |
© 2005-2022 http://www.MarketOracle.co.uk - The Market Oracle is a FREE Daily Financial Markets Analysis & Forecasting online publication.