


May Jobs: US Unemployment Skyrockets to 5.5% Confirming Recession
Economics / US Economy Jun 06, 2008 - 09:29 AM GMTBy: Mike_Shedlock

 Yahoo!Finance is reporting Unemployment rate jumps to 5.5 percent in May .
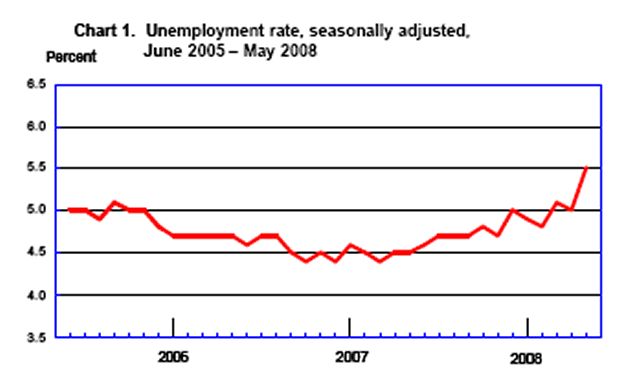
The nation's unemployment rate jumped to 5.5 percent in May — the biggest monthly rise since 1986 — as nervous employers cut 49,000 jobs. The latest snapshot of business conditions showed a deeply troubled economy, with dwindling job opportunities in a time of continuing hardship in the housing, credit and financial sectors.
"It was ugly," said Richard Yamarone, economist at Argus Research.
This was the biggest one-month jump in the rate since February 1986. The increase left the jobless rate at its highest since October 2004.
The government said the number of unemployed people grew by 861,000 in May — rising to 8.5 million. The over-the-month jump in unemployment reflected more workers losing their jobs as well as an increase in those coming into the job market — especially younger people — to look for work, the Bureau of Labor Statistics said.
A year ago, the number of unemployed stood at 6.9 million and the jobless rate was 4.5 percent.
"For the average American there is not debate that the eocnomy is in a recession," said Mark Zandi, chief economist at Moody's Economy.com. "That's because their net worth is lower, their purchasing power is lower and it is tough to find a job. If you lose a job, it is tough to get back in," he said.
BLS Report
With that lead in, let's take a look at the official report.
This morning, the Bureau of Labor Statistics (BLS) released the released the May Employment Report . Jobs were negative for a 5th consecutive month. My target of 6% or higher stated unemployment by the end of the year is easily back on track. Here is a synopsis of that report.
The unemployment rate rose from 5.0 to 5.5 percent in May, and nonfarm payroll employment continued to trend down (-49,000), the Bureau of Labor Statistics of the U.S. Department of Labor reported today. In May, employment continued to fall in construction, manufacturing, retail trade, and temporary help services, while health care continued to add jobs. Average hourly earnings rose by 5 cents, or 0.3 percent, over the month.
Establishment Data

The establishment data was the 5 consecutive decline.
Highlights
- 34,000 construction jobs were lost
- 26,000 manufacturing jobs were lost
- 27,000 retail trade jobs were lost
- 29,000 professional and business services jobs were lost
- 8,000 service providing jobs were added
Weakness is now nearly across the board. The last remaining holdouts is education and health services which added 54,000 jobs. But looking ahead there is going to be trouble in this area as states, especially California, cut back services.
These are clearly recession totals yet still we have pundits debating whether or not we are in recession.
Birth/Death Model From Alternate Universe
This was a very weak jobs report. And once again the Birth/Death Model assumptions are from outer space.
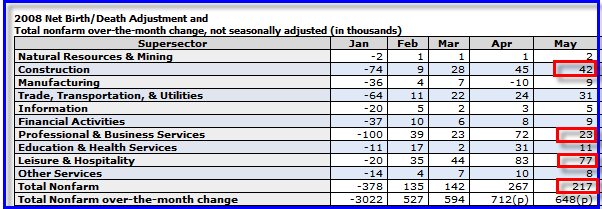
Once again the BLS should be embarrassed to report this data. Its model suggests that there was 42,000 jobs coming from new construction businesses, 23,000 jobs coming from professional services, and a whopping 217,000 jobs in total coming from net new business creation. The economy has slowed to a standstill and the BLS model still has the economy expanding quite rapidly.
Repeating what I said for months now, virtually no one can possibly believe this data. The data is so bad, I doubt those at the BLS even believe it. But that is what their model says so that is what they report.
Inquiring minds will note an additional line (the last line) on the above table this month: over-the-month-change. I have not yet found a description for this line.
BLS Black Box
For those unfamiliar with the birth/death model, monthly jobs adjustments are made by the BLS based on economic assumptions about the birth and death of businesses (not individuals). Those assumptions are made according to estimates of where the BLS thinks we are in the economic cycle.
The BLS has admitted however, that their model will be wrong at economic turning points. And there is no doubt we are long past an economic turning point.
With housing falling like a rock and commercial real estate now following suit, the BLS is assuming that 42,000 new jobs were added in construction. With lenders blowing up and countless self employed real estate professional exiting the business the BLS is assuming 9,000 new jobs were added in financial activities and 23,000 jobs from professional and business services. The total number of jobs added in May by these absurd assumptions was 217,000 jobs.
No doubt you will see some who will subtract 217,000 jobs from -49,000 jobs and conclude that 266,000 jobs were lost in May. Such math is inaccurate.
Here is the pertinent snip from the BLS on Birth/Death Methodology.
- The net birth/death model component figures are unique to each month and exhibit a seasonal pattern that can result in negative adjustments in some months. These models do not attempt to correct for any other potential error sources in the CES estimates such as sampling error or design limitations.
- Note that the net birth/death figures are not seasonally adjusted, and are applied to not seasonally adjusted monthly employment links to determine the final estimate.
- The most significant potential drawback to this or any model-based approach is that time series modeling assumes a predictable continuation of historical patterns and relationships and therefore is likely to have some difficulty producing reliable estimates at economic turning points or during periods when there are sudden changes in trend.
The important point in this mess is that both the job data and employment data are much worse than appears at first glance (and the first glance looked horrid).
Table A-12
Table A-12 is where one can find a better approximation of what the unemployment rate really is. Let's take a look
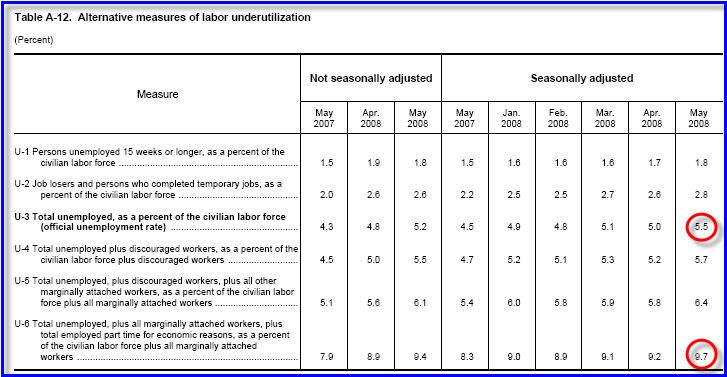
If you start counting all the people that want a job but gave up, all the people with part-time jobs that want a full-time job, etc., you get a closer picture of what the unemployment rate is. The official government number rose to 5.5%, but Table A-12 suggests it rose to 9.7%. I believe the latter number is on the low side.
This report was the 6th consecutive disaster, and 5th consecutive contraction. Service jobs were only positive because 17,000 useless government jobs were created. Somehow we are supposed to believe the economy is not in recession.
By Mike "Mish" Shedlock
http://globaleconomicanalysis.blogspot.com
Click Here To Scroll Thru My Recent Post List
Mike Shedlock / Mish is a registered investment advisor representative for SitkaPacific Capital Management. Sitka Pacific is an asset management firm whose goal is strong performance, low volatility, regardless of market direction. Visit http://www.sitkapacific.com/ to learn more about wealth management for investors seeking strong performance with low volatility. You are currently viewing my global economics blog which has commentary 7-10 times a week. I am a "professor" on Minyanville. My Minyanville Profile can be viewed at: http://www.minyanville.com/gazette/bios.htm?bio=87 I do weekly live radio on KFNX the Charles Goyette show every Wednesday. When not writing about stocks or the economy I spends a great deal of time on photography. I have over 80 magazine and book cover credits. Some of my Wisconsin and gardening images can be seen at www.michaelshedlock.com.
© 2008 Mike Shedlock, All Rights Reserved
Mike Shedlock Archive |
© 2005-2022 http://www.MarketOracle.co.uk - The Market Oracle is a FREE Daily Financial Markets Analysis & Forecasting online publication.