


Gold Long-term Rating Once more Turns Bullish
Commodities / Gold & Silver Jun 21, 2008 - 02:23 PM GMTBy: Merv_Burak

Gold was up every day this past week (and Friday of the previous) and still not really showing any great upside strength. Gold bugs always seem to think that up is the only direction but sometimes we get surprises. Are we in for one ahead?
GOLD : LONG TERM
With the continuous upside action there has been some changes to the long term indicators this past week. The price of gold has once more moved above its moving average line and the line remains in a positive slope.
The long term momentum indicator has once more moved above its trigger line and the line has turned upwards. The momentum indicator also remains in its positive zone. The volume indicator, which continues to show greater strength from the long term perspective, has once more moved above its trigger line and the line has turned up. From all this the long term rating has once more turned BULLISH .
INTERMEDIATE TERM
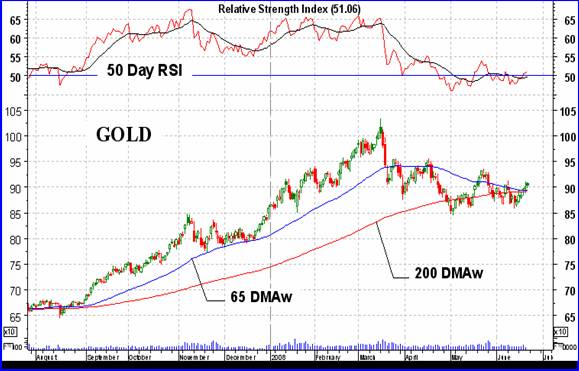
When prices go into a consolidation mode or into somewhat of a lateral trend the indicators go all haywire. They are likely to change up and down with the oscillating of the price. We have just such an activity in the intermediate term. Last week nothing seemed to be positive, this week everything seems to be. Gold is above its moving average line and the line, although not yet pointing upward, has turned into the horizontal from the negative. The momentum indicator has inched its way into the positive zone and its trigger line has turned upwards. The volume indicator has moved above its positive trigger line. Everything is in gear for a BULLISH intermediate term rating.
Taking a look at the chart one might not be too quick to go gung-ho bullish yet. There are a couple of serious resistance levels that have to be overcome before the trend can really take hold. The most serious resistance is the one at the $956 level. Once that is breached then one might breathe easier and jump into the market. Prior to that level the trend may be bullish but the risk of a whip-saw or reversal is still great.
SHORT TERM
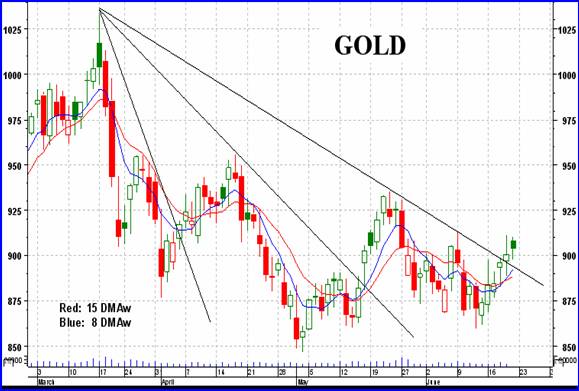
Looking at the chart from a short term perspective there are many positive things going on here. All of our normal indicators are positive; moving average, momentum, trigger lines, slope, etc. In addition to all that we have the very short term moving average line now above the short term line confirming a short term rally in progress. Also of interest is the breaking of a third decelerating FAN trend line. As some may recall the breaking of the second decelerating FAN trend line indicates an end of trend, or very close to the end, while the breaking of the third FAN trend line is confirmation of the new trend. We have here a confirmation of a new short to intermediate term bull trend.
Nothing is ever all positive or all negative. On the negative side we have a couple of short term resistance levels to watch, the first being the previous high of a couple of weeks back, at $913. The next resistance level to watch would be the May top at $935. The other interesting feature of the short term chart is Friday's action. The day started at almost its high for the day. For the rest of the day the trading was below the open. Although still up on the day, this kind of trading is often looked at as distribution rather than accumulation. In other words it might have been a day when traders were more interested in getting out than getting in. Just a thought.
Although the short term must be rated as BULLISH and the immediate direction is still positive, the Stochastic Oscillator has entered its overbought zone and there are enough indications that we might have a few down days ahead to encourage caution.
SILVER
There is no silver comment this week except to note that silver performed slightly better than gold during the week. Still, everything mentioned for gold could be applied to silver.
Precious Metal Stocks
Overall, the 160 stock universe of precious metal stocks closed just slightly higher on the week. Looking through the various sectors it looks like the quality stocks advanced slightly while the speculative stocks continued to decline. The Gamb-Gold Index had a good week with a 4.5% advance BUT only three stocks were responsible for that advance. Take away those three stocks and the Gamb-Gold Index would have had a decline of about 2% on the week, similar to the Spec-Gold Index.
The number of stocks on the advance versus the number on the decline were just about even on the week. The decliners had the advantage by only 3 stocks with 75 advancing (47%) and 78 declining (49%). The remainder were unchanged. Despite the steady advance in gold price every day of the week this did not resonate with the stocks. As we see, they were just about at a stand still on the week. Maybe next week will be different.
The U.S. Dollar Index
Gold and the $ always seem to move in opposite directions. Which one is affecting which is always a question but most analysts think that it is the $ that is the driving force. I will go in more detail on the $, with charts, at a later date but just make a few observations today.
Since the latest topping out in Nov of 2005 the $ has been in a steady decline with a few rallies here and there. Since March the $ has been going through another of its bottoming processes and attempting to rally. From the long term perspective it still has a lot of work to do but it does look like it is in an intermediate term rally. The momentum and volume indicators have been showing strength while the $ itself is now above its positive sloping intermediate term moving average line. As mentioned, I'll have more on the $ at a later time.
Merv's Precious Metals Indices Table
Note that the closing prices in red are Thursday closing prices.
That's it for this week.
By Merv Burak, CMT
Hudson Aero/Systems Inc.
Technical Information Group
for Merv's Precious Metals Central
For DAILY Uranium stock commentary and WEEKLY Uranium market update check out my new Technically Uranium with Merv blog at http://techuranium.blogspot.com .
During the day Merv practices his engineering profession as a Consulting Aerospace Engineer. Once the sun goes down and night descends upon the earth Merv dons his other hat as a Chartered Market Technician ( CMT ) and tries to decipher what's going on in the securities markets. As an underground surveyor in the gold mines of Canada 's Northwest Territories in his youth, Merv has a soft spot for the gold industry and has developed several Gold Indices reflecting different aspects of the industry. As a basically lazy individual Merv's driving focus is to KEEP IT SIMPLE .
To find out more about Merv's various Gold Indices and component stocks, please visit http://preciousmetalscentral.com . There you will find samples of the Indices and their component stocks plus other publications of interest to gold investors.
Before you invest, Always check your market timing with a Qualified Professional Market Technician
Merv Burak Archive |
© 2005-2022 http://www.MarketOracle.co.uk - The Market Oracle is a FREE Daily Financial Markets Analysis & Forecasting online publication.