


Sheffield, Yorkshire and Humberside House Prices Forecast 2016-2018
Housing-Market / Sheffield Nov 25, 2015 - 06:24 AM GMTBy: Nadeem_Walayat

 Sheffield is Britain's fifth largest city with an estimated current population of 575,000 that occupy's the south west quadrant of the county of South Yorkshire, part of the Yorkshire and Humber region. Sheffield given its central UK position, prominent rail and motorway links is a favourable destination for national and international migrants from nearby towns and further afield given its relatively affordable house prices, especially when compared against the South East.
Therefore the starting point for this analysis will be to take a close look at what is happening to house prices in the York's & Humber region where it is now well over 2 years since my last forecast made in the very early stages of the new housing bull market.
22 Sep 2013 - Sheffield House Prices Forecast, UK, Yorkshire and HumberIn terms of forecast price momentum for Yorkshire and Humberside, this region clearly lags the national average as a consequence of deeply rooted socialist economic tendencies that results in a much larger public sector, and conversely smaller private sector, the consequences of which has meant a deeper impact of government spending cuts and less developed private sector to fill the gap than for instance the South East region. Therefore I expect Y&H to lag the UK average by about 3%, thus the region targets an annual price gain momentum of 7% per annum by the end of this year.
The updated York's & Humber (Y&H) house prices graph shows that average prices have risen from an of £120,049 (June 2013) to £145,328, a rise of 21%, or an annual rate of 9.3% which is set against my forecast expectations from the then inflation rate of 3% (June 2013) to rise to an annual rate of 7%. Therefore the Y&H region has been showing relative strength of +2.3%, though still lagging the UK average as illustrated by the fact that Y&H house prices still have some way to go to set new all time highs.
The following graph shows where Y&H stands in terms of the rest of the UK.The parabolic trend is London which has soared into the stratosphere by some 70% from its bear market low. Y&H tends to be the best of the bottom 4 UK regions which is not so surprising given that house price inflation rates tend to be geared towards how close the regions are to London as capital first spills over into the nearest regions and then ripples out across the rest of the UK.
The following table gives a picture of where the regions stand in terms of deviation from the UK average of the past 20 years.
| E.Ang | E.Mids | N.Ire | N.West | North | Wales | |
| Historic | -1% | -15% | -22% | -23% | -25% | -19% |
| Current | 3% | -17% | -40% | -28% | -32% | -25% |
| 4% | -2% | -18% | -4% | -7% | -6% |
| S West | S. East | UK Av | W Midlands | Yorks & Humb | Scotland | |
| Historic | 11% | 39% | 0% | -6% | -27% | -29% |
| Current | 5% | 47% | 0% | -13% | -29% | -33% |
| -5% | 8% | 0% | -7% | -2% | -4% |
The Y&H region which is showing surprising relative strength by only exhibiting a -2% deviation at this stage which may in part be due to the prospects for HS2 and HS3, but definitely something positive is brewing in York's and Humber which is also one of my favourite UK locations for the emergence of a NEW mega-city (MANFIELD) as I covered in my 2014 UK Housing Market Ebook (FREE DOWNLOAD)
For in-depth analysis of the regions see my recent article - 23 Nov 2015 - UK Regional House Prices, Cheapest and Most Expensive Property Markets, and accompany youtube video.
Therefore in terms of trend the Y&H region does appear to be accelerating towards an out performance against the UK average, which implies that the annual inflation rate should rise from the current 9.3% rate to above 10% and probably have reached +12% a year from now, with the trend expected to continue for 3 years which is inline with my long standing UK house prices forecast published near 2 years ago -
UK House Prices Forecast 2014 to 2018 - Conclusion
This forecast is based on the non seasonally adjusted Halifax House prices index that I have been tracking for over 25 years. The current house prices index for November 2013 is 174,671, with the starting point for the house prices forecast being my interim forecast as of July 2013 and its existing trend forecast into Mid 2014 of 187,000. Therefore this house prices forecast seeks to extend the existing forecast from Mid 2014 into the end of 2018 i.e. for 5 full years forward.
My concluding UK house prices forecast is for the Halifax NSA house prices index to target a trend to an average price of £270,600 by the end of 2018 which represents a 55% price rise on the most recent Halifax house prices data £174,671, that will make the the great bear market of 2008-2009 appear as a mere blip on the charts as the following forecast trend trajectory chart illustrates:
In terms of the current state of the UK housing bull market, the Halifax average house prices (NSA) data for Oct 2015 of £204,119 is currently showing a 4.5% deviation against the forecast trend trajectory (+17%), which if it continued to persist for the term of the 5 year forecast for a 55% rise in average UK house prices by the end of 2018 would translate into an 11% reduction in the forecast outcome to approx a 44% rise.
Sheffield Housing Market - Location, Location, Location
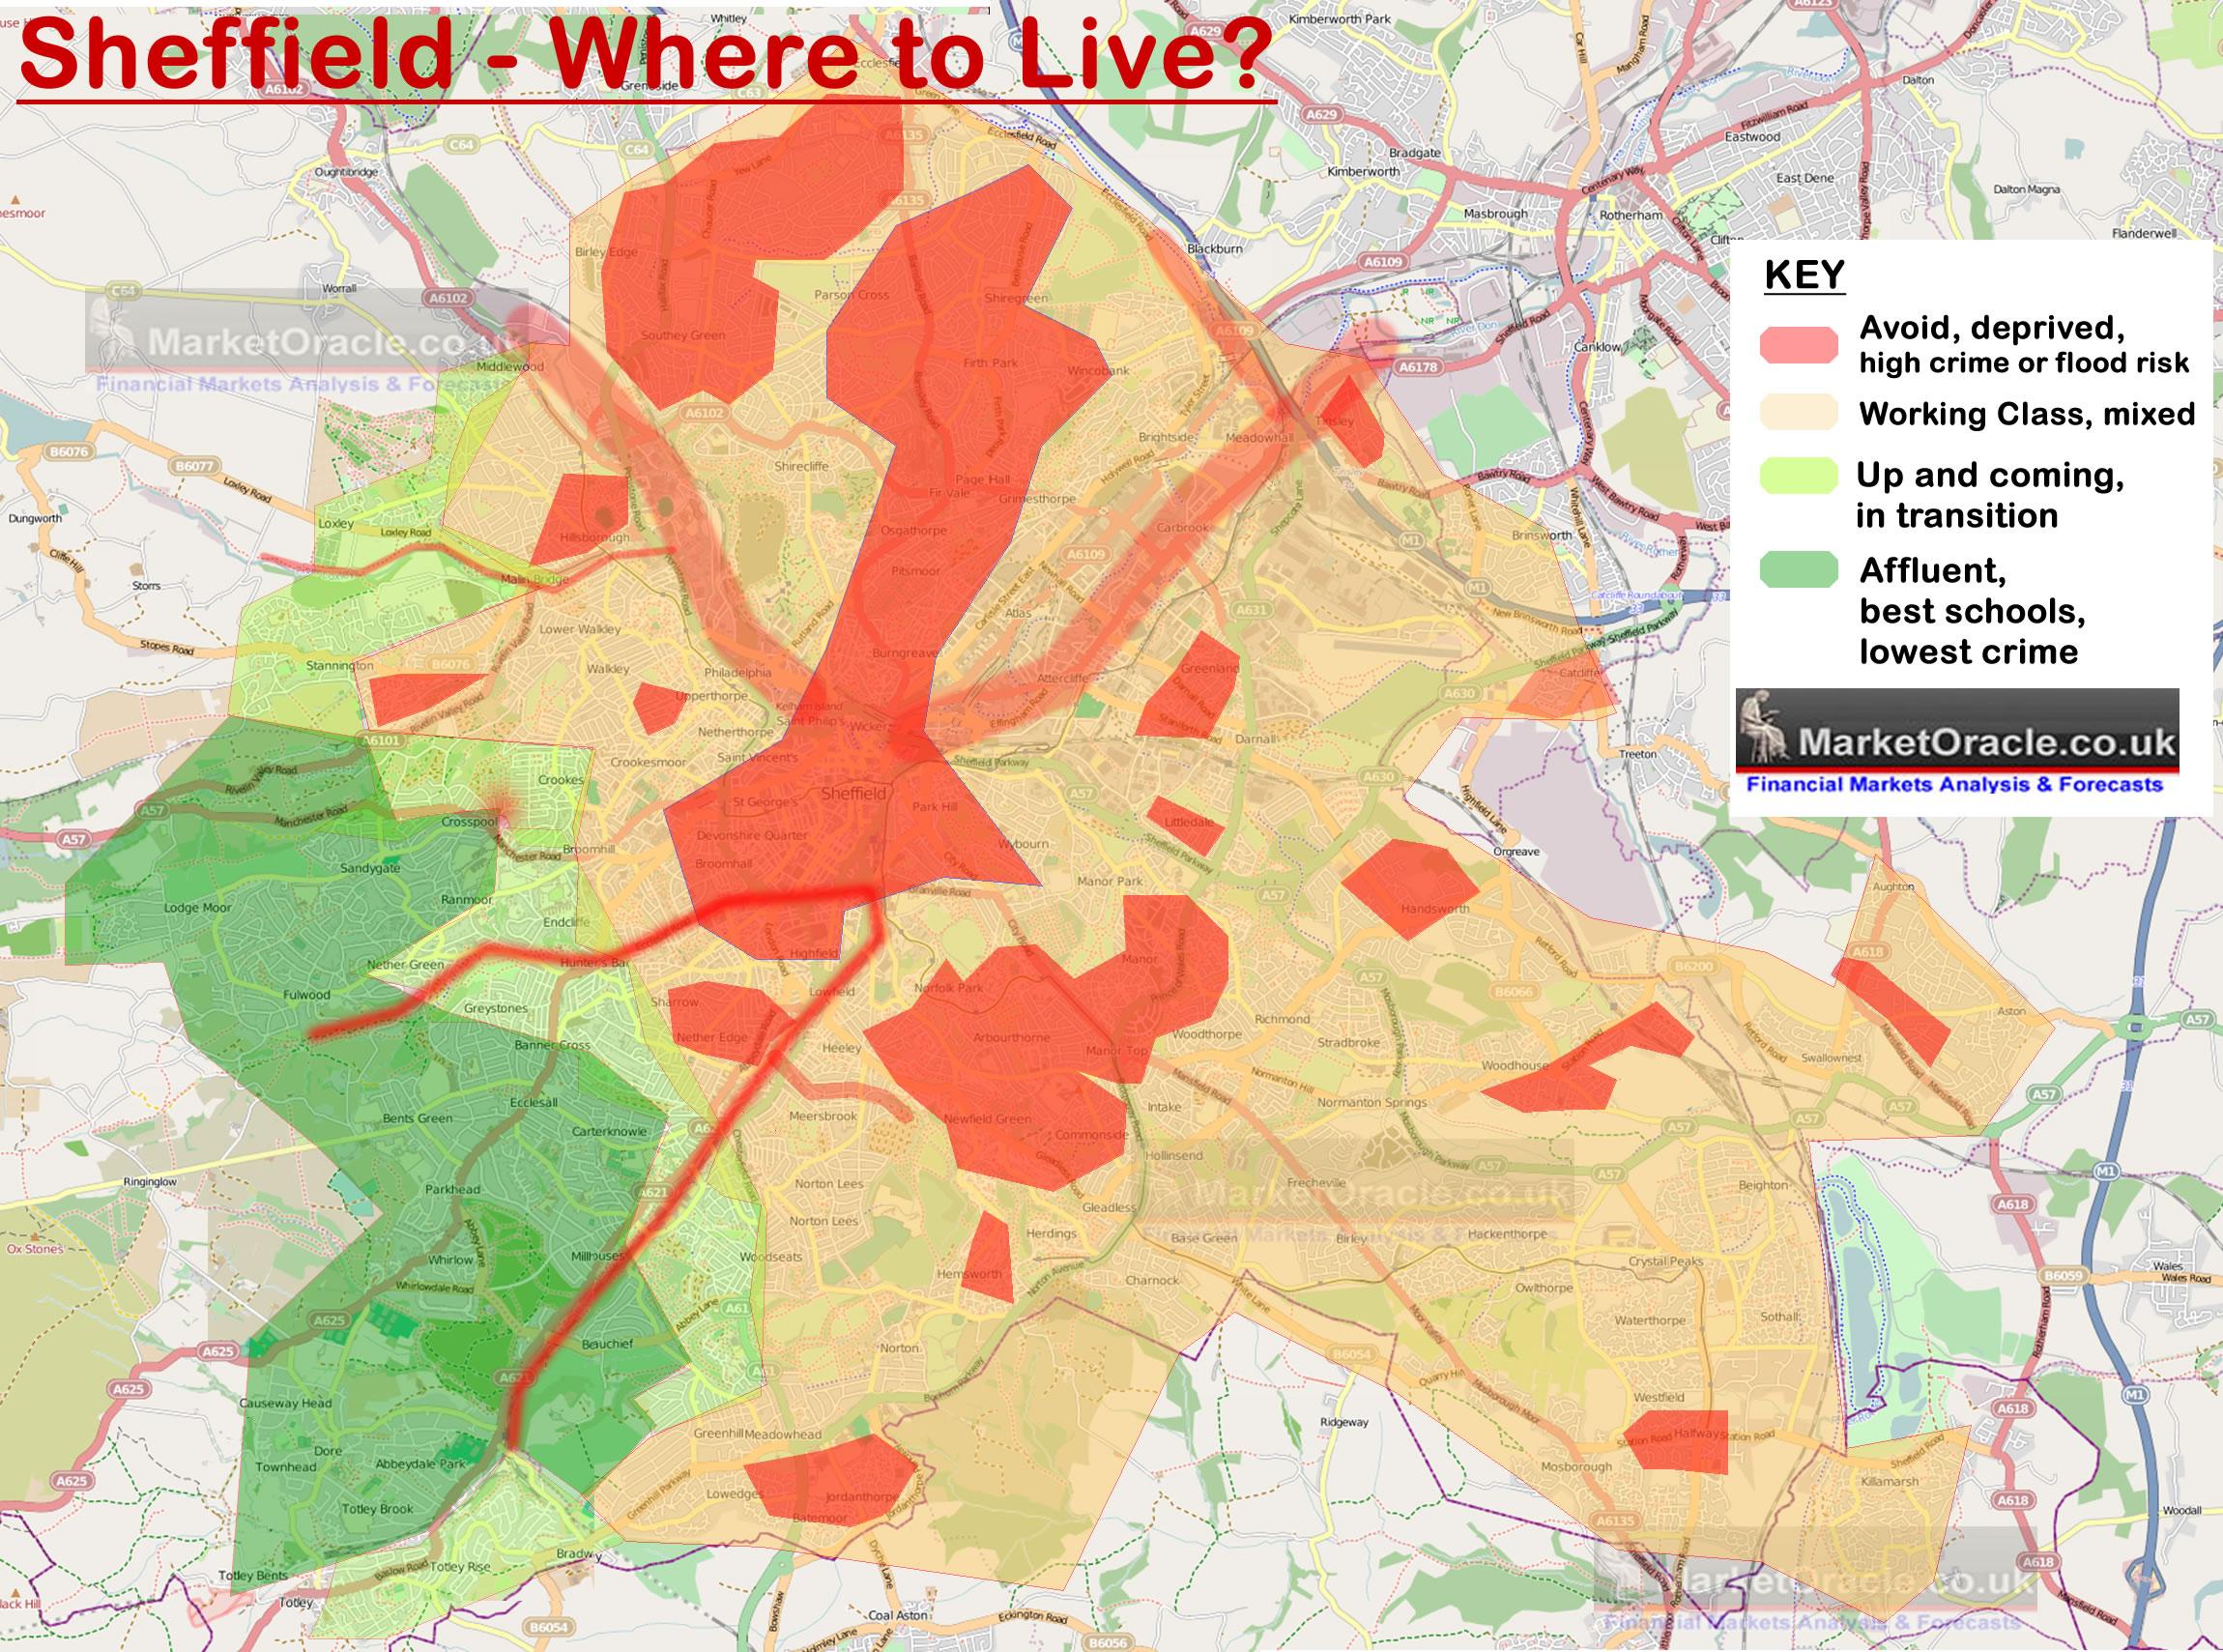
One should not need reminding that Location is the most important determinant for house purchases. This is not just limited to which region or even which city but the locations within cities are extremely important which basically means the affluent areas and then the bordering up and coming areas. My extensive analysis of October 2013 concluded in a detailed map which identified Sheffield's most favourable locations that remains equally valid today.
31 Oct 2013 - Sheffield Best and Worst Areas to Live, House Buying Analysis Map
Sheffield's Best Places to Live
The below map details which areas of Sheffield should be avoided and which areas should be favoured in terms of the best places to live. Obviously the amount of financing available will play an important factor in determining the choice of area's, but at a minimum the RED areas should be avoided as people moving to Sheffield, purchasing a property for their own residency in a Red area will soon come to regret their decision.
The large expanse of orange area's are as a consequence of the size of Sheffield's public sector and the private sector that directly relies on it, that continues to see deep cuts in local government spending, this also means that there is a continuing large supply of properties in these areas of Sheffield which acts to depress average house prices that masks booms taking places in pockets of the city and thus offers many opportunities towards the middle end of the property market.
Meanwhile prospective home buyers can expect a huge jump in financing requirements to purchase a property in the affluent areas of the city (Dark Green) which are situated in the the South West of the city as these areas will have experienced little in terms of the impact of the economic depression with the consequences and in terms of expected house prices is that just like many areas of London, these areas are already trading near their pre-crash levels as these are the areas that will be those that are in greatest NATIONAL demand, just as many parts of London are in great INTERNATIONAL demand (as high as 50% of properties in many areas of London are bought by foreign investors).
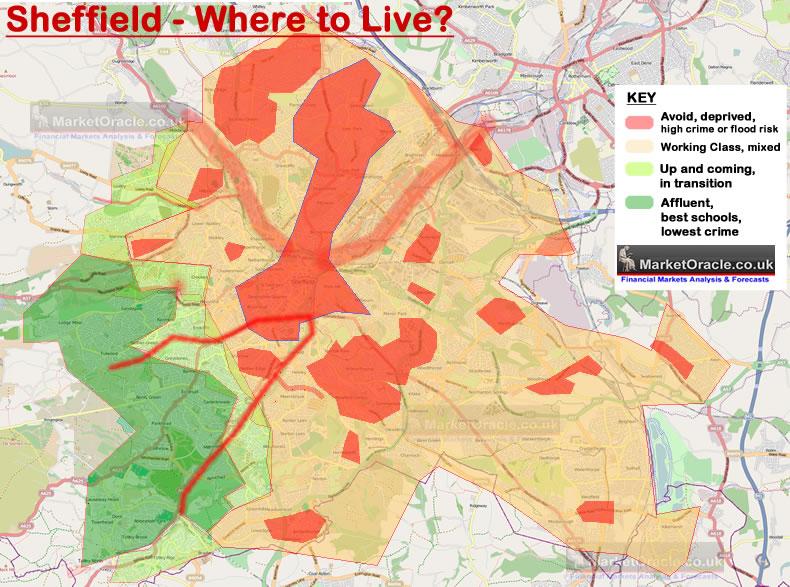
Click here for a Large version of the Where to Live Map
In summary, prospective home buyers should take notice of the fragmented nature of the city which can make a huge differences both in terms of the quality of life, school catchment etc. However, the best areas of the city can be found to be concentrated in the South West of the city as the affluent residents continue to price most local house hunters out of these areas, just as is the case for many areas of the UK. Furthermore, the most affluent area's of the city tend to have a buffer zone of up and coming areas that acts to further the gap in house prices between relatively short distances.
What this means is that whilst the pseudo-economists (journalists) that populate the mainstream media focus on average house price trends, instead the reality is of a highly fragmented and buffered market that results in areas of Sheffield that rival anything that can be seen in the South East of England in terms of house prices, which I am sure will come as a shock to many house hunters who tend to look at the academic statistics, the averages that will FAIL to give a true picture of Sheffield's housing market for instance a 4 bedroom detached house in S11 typically starts at £400k, whereas 2 or 3 miles distance a similar sized 4 bed would typically cost less than £200k.
Sheffield House Prices
Back in Sept 2013 with Mid 2013 data my forecast for Sheffield was for average house price inflation to rise from +2% to +5.4% by Mid 2014 i.e. to under perform the then expected regional average of 7%, and as the following graph illustrates a divide of sorts was expected between affluent areas of the city and the rest.
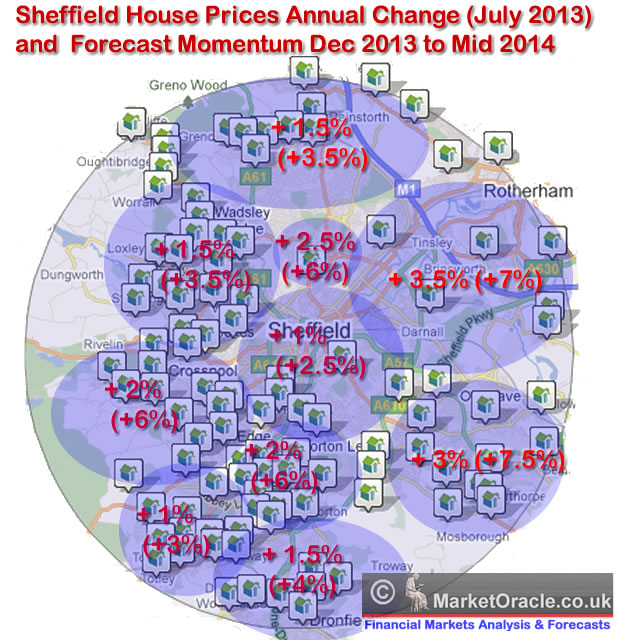
Whilst Sheffield's average house prices did perform as expected by rising by 5%, however there was greater leverage towards the affluent areas than the deprived areas which was as a consequence of the subsequent large influx of eastern european migrants that accelerated following the 1st of Jan 2014 opening of European borders that had the effect if depressing house prices in the north and centre of the city as those who are able to move have done so towards the South and West of the city thus pushing house prices higher as I covered during 2014:
23 May 2014 - Sheffield, Rotherham Temporary House Prices Crash Triggered by New Roma Ghetto's
The consequences of which are manifesting themselves in a house prices crash in many areas as those that can move out are increasingly acting to do so by dropping their asking prices sharply lower that has acted to temporarily drag the average for the city as a whole to a -2%.
To highlight the brewing tensions, earlier this week a disturbance in Page Hall involving an estimated 50 youths has resulted injuries, several arrests and an ongoing heavy police presence. With gangs of youth and men standing on street corners for hours, then such disturbances look set to become increasingly more frequent during the hot summer months ahead though unlikely to further depress average house prices for the city as a whole where the underlying trend is one of an imminent house prices boom, which will prove quite a shocking experience for those attempting to sell from within the depressed areas and buy elsewhere in the city as the change in house prices experienced could be as much as a 30% difference!
Sheffield House Prices Forecast 2016-2018
Currently Sheffield is up just 13% on the bear market low at an average of £125k, which compares to the Y&H average of £145k up 27% and the UK average of £204k, +29%. So the capital city of the peoples republic of South Yorkshire continues to under perform the regional average, a situation that is likely to persist for several more years as Sheffield only tends to play catchup towards the last stage of a bull market. Nevertheless, going forward the spread between Y&H and Sheffield should not significantly widen and likely will see some contraction i.e. a couple of years from now Sheffield may be outperforming the Y&H average.
The updated Sheffield house prices map illustrates the average annual rate of house price inflation to expect over the NEXT 3 years, i.e. not the current rate of house price inflation but the average for the 2016, 2017 and 2018. Therefore for an approx 3 year forecast multiply the average by 3 i.e. a Sheffield city average of 7% converts into a 21% forecast rise in house prices over the next 3 years.
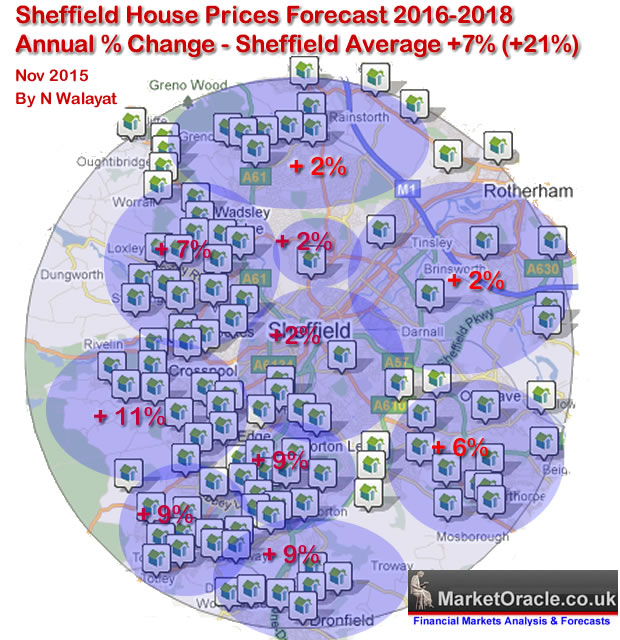
Another point to mention apart from the importance of location is the type of property i.e. detached properties will tend to perform the best, then semi-detached, then terraced with Flats by far the worst. In fact I would suggest to avoid buying flats in ANY location, affluent or not for reasons that I have covered at length in my 2014 Housing Market ebook (Free Download)
Ensure you are subscribed to my always free newsletter for ongoing in-depth analysis and concluding detailed trend forecasts that include the following planned newsletters -
- London House Prices Bubble
- US House Prices
- US Dollar Trend Forecast
- Stock Market 2016
- Islam 3.0
 Also subscribe to our Youtube channel for notification of video releases and for our new series on the 'The Illusion of Democracy and Freedom', that seeks to answer questions such as 'Did God Create the Universe?' and how to 'Attain Freedom' as well as a stream of mega long term 'Future Trend Forecasts'.
By Nadeem Walayat
Copyright © 2005-2015 Marketoracle.co.uk (Market Oracle Ltd). All rights reserved.
Nadeem Walayat has over 25 years experience of trading derivatives, portfolio management and analysing the financial markets, including one of few who both anticipated and Beat the 1987 Crash. Nadeem's forward looking analysis focuses on UK inflation, economy, interest rates and housing market. He is the author of five ebook's in the The Inflation Mega-Trend and Stocks Stealth Bull Market series that can be downloaded for Free.


 Nadeem is the Editor of The Market Oracle, a FREE Daily Financial Markets Analysis & Forecasting online publication that presents in-depth analysis from over 1000 experienced analysts on a range of views of the probable direction of the financial markets, thus enabling our readers to arrive at an informed opinion on future market direction. http://www.marketoracle.co.uk
Disclaimer: The above is a matter of opinion provided for general information purposes only and is not intended as investment advice. Information and analysis above are derived from sources and utilising methods believed to be reliable, but we cannot accept responsibility for any trading losses you may incur as a result of this analysis. Individuals should consult with their personal financial advisors before engaging in any trading activities.
Nadeem Walayat Archive |
© 2005-2022 http://www.MarketOracle.co.uk - The Market Oracle is a FREE Daily Financial Markets Analysis & Forecasting online publication.