The Natural Gas Trading Play
Commodities /
Natural Gas
Dec 20, 2015 - 06:33 AM GMT
By: EconMatters

 Bearish Sentiment
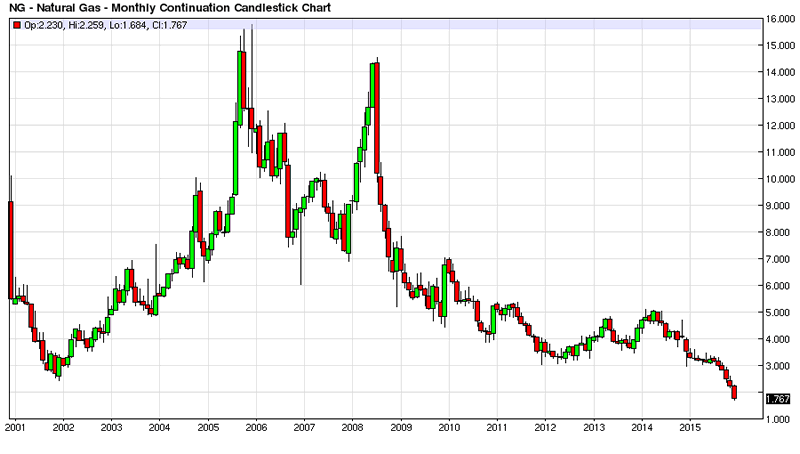
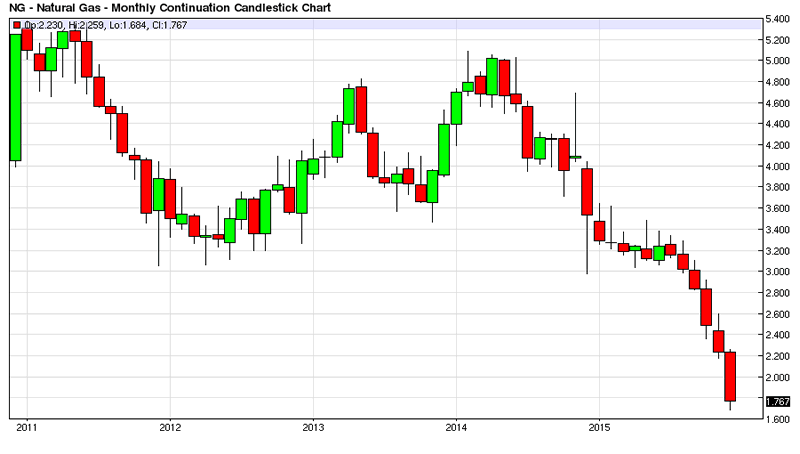
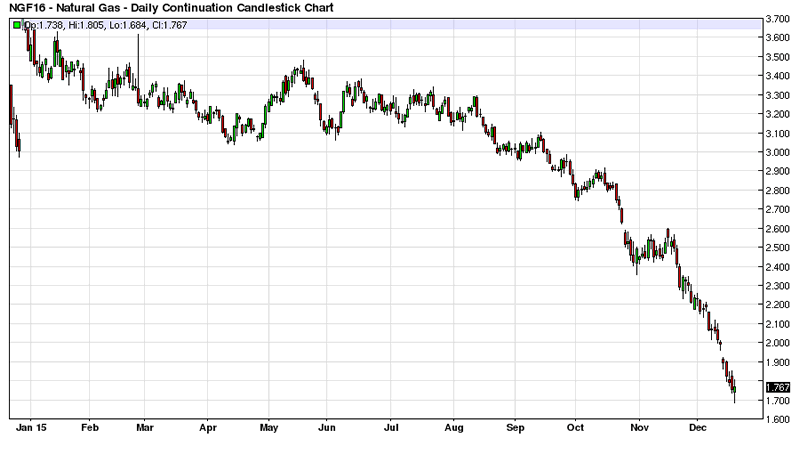
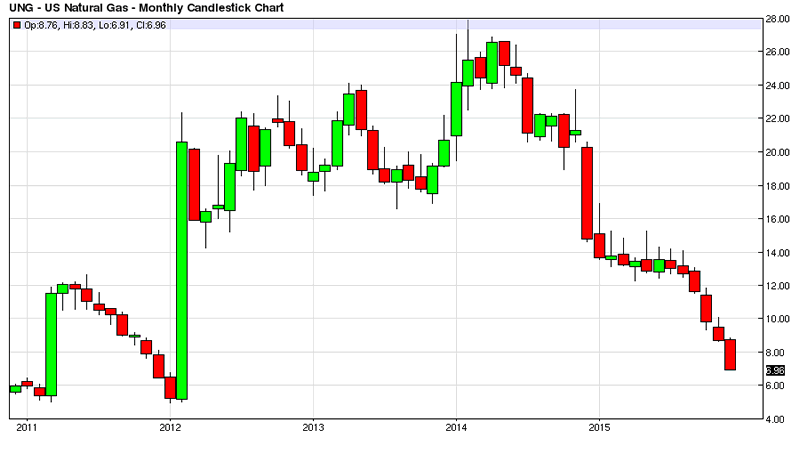
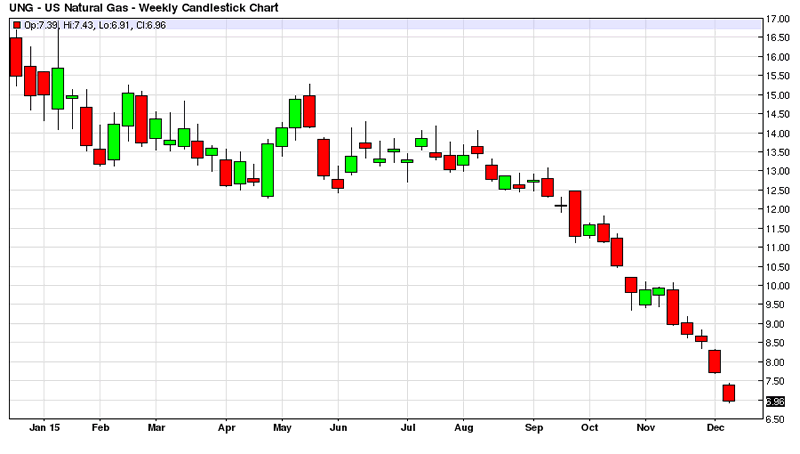
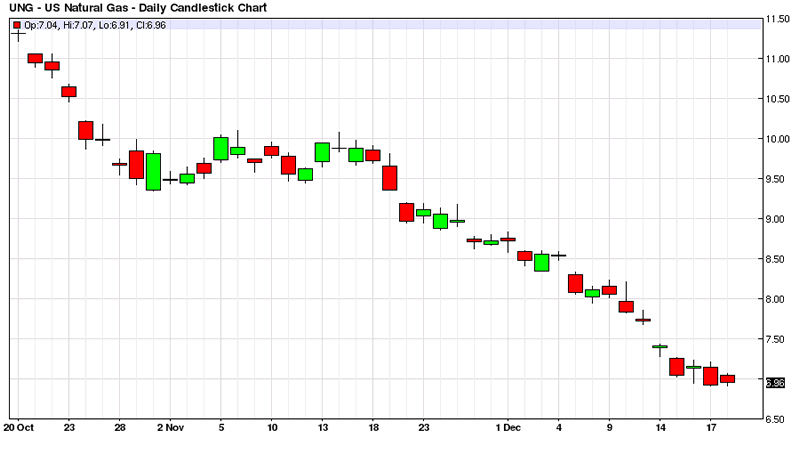
 A lot of bearishness has been priced into the natural gas market due to many factors including robust production, bulging inventories, and mild weather on average across the country. Natural gas in the futures market reached a low of $1.68 MMBtu for Henry Hub on the January contract this past week. Natural gas closed trading on Friday at around $1.77 MMBtu.
These prices for natural gas are the lowest in 15 years and the questions that accompany such lows are the following: How low can prices go, do these low prices create a buying opportunity, what kind of timeframe is involved, and what is the best strategy for capitalizing on a rebound in natural gas prices.
How Low
In regard to how low natural gas can go, back in 2012 traders and analysts were talking about sub $1 MMBtu natural gas based on the fact that the derivative product`s markets related to natural gas production were actually booming for the specialty gases. Hence a producer was incentivized to produce natural gas below costs because the margins were so high for the specialty gases associated with producing natural gas in the drilling process. In 2012 natural gas for the front month contract in Henry Hub futures dipped briefly below $2 MMBtu around the time when traders were discussing sub $1 natural gas.
Given the fact that even the best traders and market analysts have no idea the exact low point for any market, let us just use this $1 MMBtu price for the worst case scenario for how low natural gas prices can go. I firmly believe in the rationality of financial markets in the longer term, and from this follows the old trading axiom that there is no cure for low prices like low prices. I don`t think there is that much more money to be made from the short side of the natural gas market over the same three year time frame.
Buying Opportunity
Therefore I view the current price of natural gas as a buying opportunity over a three year time horizon. I realize that I cannot predict the bottom in the market, and I am not going to try and be perfect regarding timing the turn in the market. However, I do predict given the decline in oil and gas drilling rigs, the economics of producing below longer term costs, and the fact that markets often lead the fundamentals, that this represents a buying opportunity in natural gas. I am basically buying when everyone else and their grandma is selling the natural gas market. I am sure corporations, wildcatters and trading firms are all making business decisions based upon these low natural gas prices, and they are not from the bullish side of the equation. I want to be on the other side of this trade given my three year time horizon.
Timeframe
As I mentioned the timeframe for this trade or investment decision to play out is three years. Do I think the natural gas market will put in a bullish move more towards the front end of this timeframe? I would say the probabilities are sufficient to suggest that I may be trading around a core position that has substantial profits during this 3 year time frame, as a year is an eternity in a market like natural gas. Natural gas can easily move to $5 MMBtu in a reduction in production and an extremely hot summer, followed by an overly brutal winter heating season.
The market can really trend, it can spike, it can retrace, and it can do all kinds of strange things. Remember two winters ago? I am confident the investment makes money over a three year time frame, and it is up to the individual where and when to take profits on the trade. It may make sense to reallocate capital after a nice fifteen month`s trending move in natural gas, or it may make sense to just ride the trade well past three years if circumstances dictate.
Upside Variables?
There are so many unpredictable variables like more Power Generation continuing to transfer from coal based to natural gas, the economy starts growing 3 to 4% instead of 2%, demand outstrips existing capacity in the electricity market, demand for a period outstrips supply in natural gas, an insane hurricane season knocking production offline and doing damage to natural gas infrastructure.
What I do know is one way or another natural gas somehow finds its way back to the $5 MMBtu level even during the shale revolution. I expect that sometime over the next three years natural gas finds its way back to this ‘natural gravitational’ market price. It may even make several trips up to $5 MMBtu over the course of the next three years. It was just over $7 MMBtu two winters ago after the last crushing of the market back in 2012 to below $2 MMBtu. It took just two short years to really move well above the $5 level.
Best Strategy
The best strategy for playing this move depends on a trader`s resources. Most traders are not going to employ swaps, options or other derivatives due to resource constraints and sophistication concerns. Investors could buy futures and just roll over the positions each month, buy back dated futures contracts, or even buy stocks highly correlated to the price of natural gas. But with bankruptcy and individual company specific concerns I would stay away from this option until more visibility on the ramifications of sub $2 natural gas plays out on companies` balance sheets.
You don`t want to be forced out of the trade due to factors outside of your control like management incompetence that wipes out your equity stake before natural gas prices recover which is open-ended to a large extent. Rolling over the futures contract may be more than the average investor is willing to stomach, and the volatility of the front month futures contract may create havoc on one`s sleeping bliss after a poor inventory report. The back month futures contracts have some premium factored into them as well, and liquidity concerns are involved.
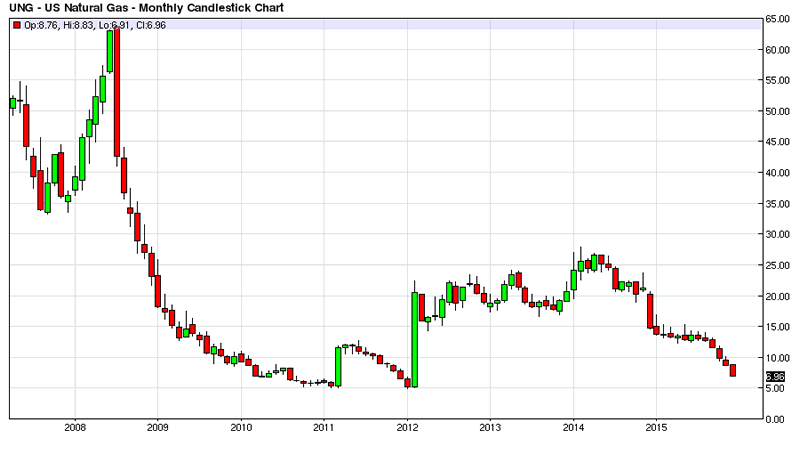
UNG ETF
I would recommend using the UNG ETF, it has been around since 2007, has decent volume, consists of natural gas futures contracts, and roughly tracks the price of the natural gas market over the last eight years. It isn`t going to totally fall apart like some of those poorly constructed ETFs that are supposed to track markets but inevitably lose value over time regardless of long term price returns of the underlying assets being tracked.
In short, this instrument will do what an investor needs to accomplish to track any rebound in natural gas prices over the next three years without being margined out of the market or having to worry about timing this rebound perfectly. I would not worry about trying to scale into a position based upon price. If one is using size on this investment then a nice Algo buying program will suffice for next week`s action. We are not trying to pick a bottom here, we expect that prices can go lower, but the current price represents value for us over a three year time frame both from a trading an investment standpoint.
The question here is can I make money at these prices if I buy right now over the next three years. Am I going to be able to stay in this trade until the turn plays out in the natural gas market? And will I be able to at least double my initial investment over this timeframe if this is my longer term goal? My analysis is that the affirmative case can be made for these questions. The minimum profit goal is 20% on this investment play. An investor should not be looking to take any profits on this play until this minimum profit threshold is met.
Therefore, assuming an investor has an average position price in UNG around $7 a share, the minimum profit target would be $8.75 a share for any timeframe during this three year investment window for justifying taking off this trade from a profit perspective. This trade profile is built upon being rewarded for taking risk and providing liquidity to a market that is basically in freefall mode. A 5% profit target on the trade is just poor risk reward trade management. Keep this in mind when thinking about profit targets for this investment.
Therefore unless I have a better opportunity with the same risk to reward profile for this investment capital over the next three years then this is a good place to park some capital and put it to work for me. I realize this play seems highly contrarian in the current market environment, and this is a positive, it means that I am being paid for taking this risk, and my upside reward is what makes this play worthwhile in my trading book.
By EconMatters
http://www.econmatters.com/
The theory of quantum mechanics and Einstein’s theory of relativity (E=mc2) have taught us that matter (yin) and energy (yang) are inter-related and interdependent. This interconnectness of all things is the essense of the concept “yin-yang”, and Einstein’s fundamental equation: matter equals energy. The same theories may be applied to equities and commodity markets.
All things within the markets and macro-economy undergo constant change and transformation, and everything is interconnected. That’s why here at Economic Forecasts & Opinions, we focus on identifying the fundamental theories of cause and effect in the markets to help you achieve a great continuum of portfolio yin-yang equilibrium.
That's why, with a team of analysts, we at EconMatters focus on identifying the fundamental theories of cause and effect in the financial markets that matters to your portfolio.
© 2015 Copyright EconMatters - All Rights Reserved Disclaimer: The above is a matter of opinion provided for general information purposes only and is not intended as investment advice. Information and analysis above are derived from sources and utilising methods believed to be reliable, but we cannot accept responsibility for any losses you may incur as a result of this analysis. Individuals should consult with their personal financial advisors.
© 2005-2022 http://www.MarketOracle.co.uk - The Market Oracle is a FREE Daily Financial Markets Analysis & Forecasting online publication.