


Stocks Bear Market Uptrend Nearing its Peak
Stock-Markets / Stocks Bear Market Feb 28, 2016 - 08:17 AM GMTBy: Tony_Caldaro

 The market started the week at SPX 1918. After a gap up opening on Monday the market rallied to SPX 1947. After that it pulled back, aided by two gap down openings, to SPX 1891 by Wednesday. Then helped by two gap up openings the market rallied to SPX 1963 by Friday, and ended the week at 1948. For the week the SPX/DOW gained 1.55%, the NDX/NAZ gained 1.80%, and the DJ World index gained 0.90%. Economic reports for the week were neutral. On the uptick: Q4 GDP, durable goods, the FHFA, personal income/spending, the PCE, and existing home sales. On the downtick: Case-Shiller, consumer confidence/sentiment, new home sales, the WLEI, GDPn, plus weekly jobless claims increased. Next week’s reports are highlighted by the FED’s Beige book, the ISM’s and monthly Payrolls. Best to your week!
LONG TERM: bear market
After the market made a Primary III high at SPX 2135 in May, then lost 12.6% market value into August at SPX 1867, there was some debate over whether or not that correction was all, or part, of Primary wave IV. Then when the market rallied quite strongly in October, off a secondary SPX 1872 low in September, hitting SPX 2116 in November, that debate subsided. When the SPX failed to make a new all time high in December, and the market sold off to a lower low in February at SPX 1810. Market pundits again brought up an ongoing Primary IV scenario. Now with the market rallying strongly the past two weeks, a renewed call for Primary wave V underway is gaining some momentum.
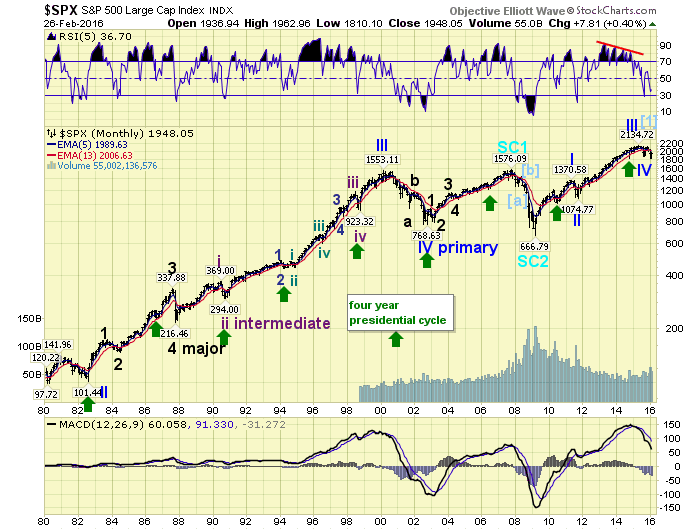
Above is the monthly SPX chart from 1980. Observe how the MACD bounced off of neutral all through the 1980’s and then soared in the latter half of the 1990’s. It peaked in 1999, and then continued a long decline during the 2000-2002 bear market. After that bear market ended it again turned up, reaching a peak right around the high of the 2002-2007 bull market. Then again it started a long decline into the bear market low in 2009. During the 2009-2015 bull market it rose to a new high, peaking in late 2014. Observe that it is already declining, like the previous bear markets. This alone suggests the bull market ended in 2015, along with Primary waves IV and V, and a new bear market is underway.
We continue to label the five Primary wave, Cycle [1], bull market ending with a failed fifth wave in December 2015 at SPX 2104. The first downtrend of the bear market appears to have bottomed at SPX 1810 this month. After that low the first uptrend appears to be underway reaching a high of SPX 1963 thus far. When this uptrend concludes, we are expecting the bear market to start making new lows during the next downtrend. Longer term we are expecting the market to lose 45% to 50% of its value during this bear market. Ending sometime in 2017 around SPX 1100.
MEDIUM TERM: uptrend likely underway
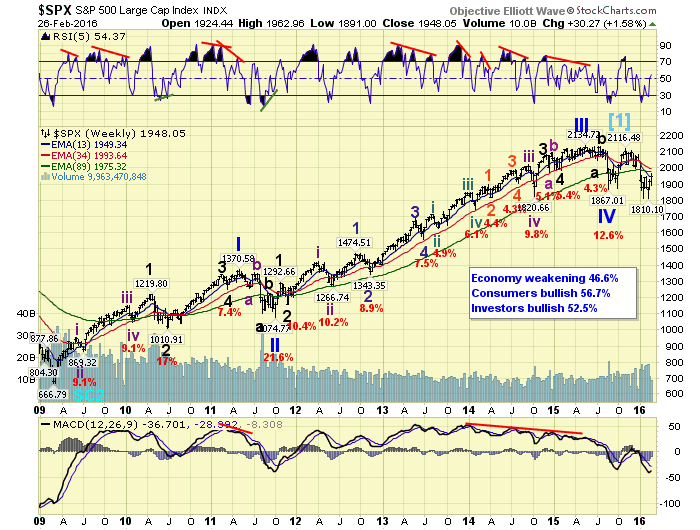
After the unorthodox bull market high at SPX 2104 in December we labeled five waves down into the February low at SPX 1810. While the waves did not look like clean impulse waves, they were impulsive enough to be counted as five down. During bear markets, as well as corrections, the form patterns take is nearly always more important than the internal structure.
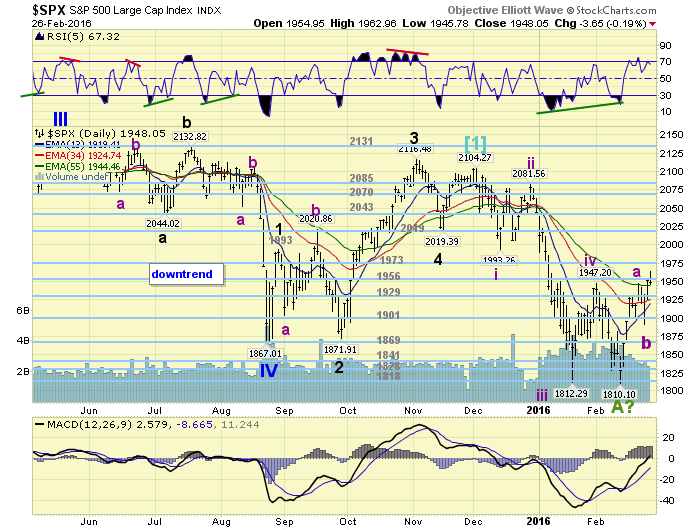
We have tentatively labeled the SPX 1810 low as Major wave A of an ABC Primary A decline. The bear market should consist of three Primary waves: ABC. The recent rally we are labeling as Intermediate waves a-b-c, of a Major wave B uptrend. Intermediate wave A ended at SPX 1947, Intermediate wave B ended at SPX 1891, and Intermediate wave C has been underway this week. When it concludes, which may be next week, Major wave B will end, and a downtrending Major wave C, to new bear market lows, will be underway. Medium term support is at the 1929 and 1901 pivots, with resistance at the 1956 and 1973 pivots.
SHORT TERM
Intermediate wave A unfolded in seven waves SPX: 1836-1822-1888-1875-1931-1902-1947. This could be counted as a double zigzag, or a simple zigzag. The simple zigzag would be the first five waves up to SPX 1931 as Minor a, then Minor b 1902, and Minor c at 1947. Either way it was a corrective advance. Intermediate wave B was a quick three wave decline that could be counted SPX: 1919-1927-1891. Intermediate wave C has thus far rallied in four waves, SPX: 1939-1925-1963-1946. Normally we would expect another seven wave advance for Int. C, similar to the seven wave advance of Int. A. Corrective waves usually unfold in similar patterns.
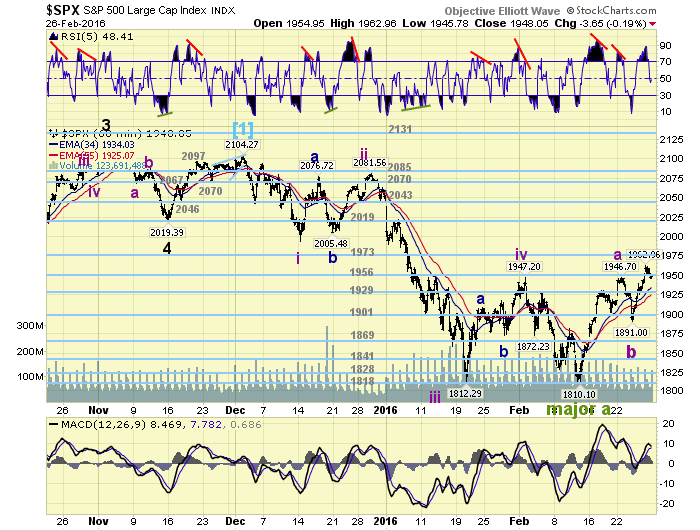
Targeting the potential high for this Major wave B uptrend we have been noting several levels of resistance. First, retracements of the prior downtrend suggest SPX: 1963 (50%) and 1999 (61.8%). Second, Fibonacci relationships of Int. C to Int. A suggest SPX: 1960 (50%), 1976 (61.8%) and 2028 (100%). Third, the following OEW pivot ranges also come into play: 1956, 1973 and 2019. When we combine all the relationships we arrive with the following: the 1956 and 1973 pivots, SPX 1999, and the 2019 pivot. The first week of March sets up for an important turning point in this bear market.
Short term support is at the 1929 and 1901 pivots, with resistance at the 1956 and 1973 pivots. Short term momentum ended the week at neutral. Best to your trading this volatile market
FOREIGN MARKETS
Asian markets were mixed on the week for a net loss of 0.8%.
European markets were all higher for a net gain of 2.4%.
The Commodity equity group were mostly higher and gained 1.2%.
The DJ World index gained 0.9%.
COMMODITIES
Bonds continue to uptrend but lost 0.1% on the week.
Crude soared 10.3% for the week as it tries to establish an uptrend.
Gold continues to uptrend but lost 0.5% on the week.
The USD is also trying to sustain an uptrend and gained 1.5% on the week.
NEXT WEEK
Monday: Chicago PMI and Pending home sales around 10am. Tuesday: Construction spending, ISM manufacturing, and Auto sales. Wednesday: the ADP and the FED’s Beige book. Thursday: weekly Jobless claims, Factory orders, and ISM services. Friday: monthly Payrolls and the Trade deficit.
CHARTS: http://stockcharts.com/public/1269446/tenpp
After about 40 years of investing in the markets one learns that the markets are constantly changing, not only in price, but in what drives the markets. In the 1960s, the Nifty Fifty were the leaders of the stock market. In the 1970s, stock selection using Technical Analysis was important, as the market stayed with a trading range for the entire decade. In the 1980s, the market finally broke out of it doldrums, as the DOW broke through 1100 in 1982, and launched the greatest bull market on record.
Sharing is an important aspect of a life. Over 100 people have joined our group, from all walks of life, covering twenty three countries across the globe. It's been the most fun I have ever had in the market. Sharing uncommon knowledge, with investors. In hope of aiding them in finding their financial independence.
Copyright © 2016 Tony Caldaro - All Rights Reserved Disclaimer: The above is a matter of opinion provided for general information purposes only and is not intended as investment advice. Information and analysis above are derived from sources and utilising methods believed to be reliable, but we cannot accept responsibility for any losses you may incur as a result of this analysis. Individuals should consult with their personal financial advisors.
Tony Caldaro Archive |
© 2005-2022 http://www.MarketOracle.co.uk - The Market Oracle is a FREE Daily Financial Markets Analysis & Forecasting online publication.