


China New Stocks Bull Market Underway?
Stock-Markets / Chinese Stock Market Sep 08, 2016 - 06:36 PM GMTBy: Tony_Caldaro

 If it wasn’t for the quantification of waves by OEW this volatile index would look more like a commodity index than a stock index. When reviewing the entire history of the SSEC we see a series of volatile up moves followed by longer and less volatile down moves. In fact, nearly all of the bullish trends have lasted only 1-2 years, while the bearish trends have taken as long as 4 years.
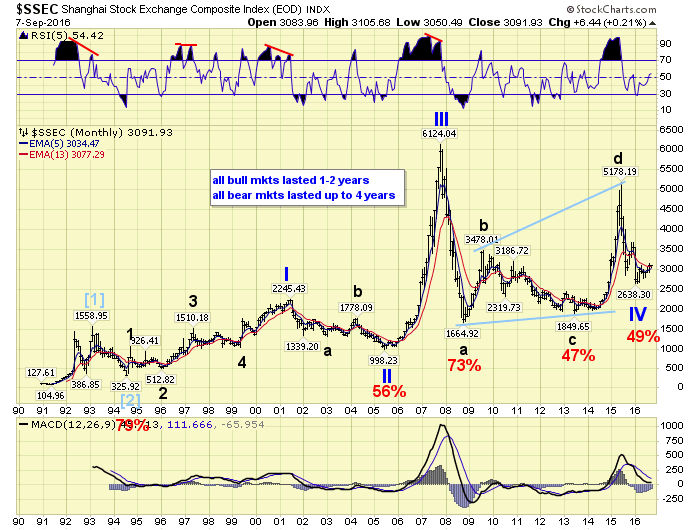
After a very volatile beginning in the early 1990’s the SSEC settled into a nice 5 waves up from 1994-2001: Primary I. Then after a 4-year bear market into 2005, Primary II, the SSEC finally joined the 2002/03-2007 worldwide bull market. The early stages of Primary III, 2005-2007, were almost unnoticeable. A series of small waves setting the stage for what would become a six-fold advance in only two years. The bear market that followed, Primary IV, has been the tricky part for nearly everyone.
The key to this long term count remains the Primary I high back in 2001 at SSEC 2245. Since fourth waves cannot overlap first waves, and two of the down legs did, the only pattern that could describe this choppy 9-year activity is an expanding triangle. As long as a fourth wave triangle terminates above the first wave high the pattern is acceptable. And this is what we believe has just occurred, after tracking this pattern for a number of years.
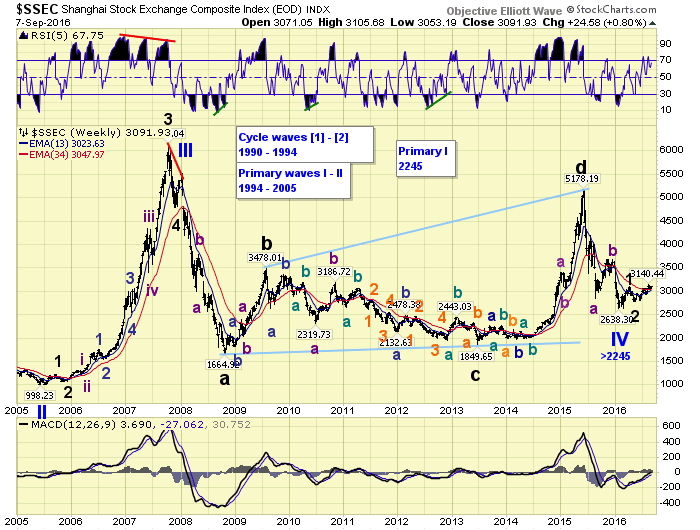
The weekly chart displays all of Primary waves III and IV. Notice how all the up legs, Primary III, and Majors B and D, all started off with a series of non-descript small waves setting the stage for the surge that would follow. The market appears to be at a similar juncture again. If the January, 2016 low ended Primary wave IV, as we suspect, the SSEC is now setting up for a move to all time new highs in the next 1-2 years.
This is not an investment recommendation, as we do not make recommendations. We only track the waves and report the most probable path based on this analysis. We suggest everyone do their own analysis and make their own investment decisions. If you would like to track the SSEC along with us, you can find the charts by scrolling down using the following link: https://stockcharts.com/public/1269446/tenpp/8. Best to your investing!
CHARTS: http://stockcharts.com/public/1269446/tenpp
After about 40 years of investing in the markets one learns that the markets are constantly changing, not only in price, but in what drives the markets. In the 1960s, the Nifty Fifty were the leaders of the stock market. In the 1970s, stock selection using Technical Analysis was important, as the market stayed with a trading range for the entire decade. In the 1980s, the market finally broke out of it doldrums, as the DOW broke through 1100 in 1982, and launched the greatest bull market on record.
Sharing is an important aspect of a life. Over 100 people have joined our group, from all walks of life, covering twenty three countries across the globe. It's been the most fun I have ever had in the market. Sharing uncommon knowledge, with investors. In hope of aiding them in finding their financial independence.
Copyright © 2016 Tony Caldaro - All Rights Reserved Disclaimer: The above is a matter of opinion provided for general information purposes only and is not intended as investment advice. Information and analysis above are derived from sources and utilising methods believed to be reliable, but we cannot accept responsibility for any losses you may incur as a result of this analysis. Individuals should consult with their personal financial advisors.
Tony Caldaro Archive |
© 2005-2022 http://www.MarketOracle.co.uk - The Market Oracle is a FREE Daily Financial Markets Analysis & Forecasting online publication.