


CONTINENTAL RESOURCES: Example Of What Is Horribly Wrong With The U.S. Shale Oil Industry
Commodities / Shale Oil and Gas Feb 22, 2017 - 09:58 AM GMTBy: Steve_St_Angelo

 According to Continental Resources website, it labels itself as America’s oil champion. To be a champion, one is supposed to be winner. Unfortunately for Continental, it’s taking a serious beating and is a perfect example of what is horribly wrong with the U.S. Shale Oil Industry.
During the beginning of the U.S. shale energy revolution, the industry stated it would make the United States energy independent. The mainstream media picked up this positive theme and ran with it. Americans who wanted to believe in this “Growth forever” notion, had no problem going further into debt to buy as much crap as they could to fill their homes and additional rental storage units.
For several years, the U.S. Shale Revolution seemed like it was going to defy the laws of gravity (and finance) to provide the country with limitless oil production forever. However, something started to go seriously wrong as these shale oil companies reported their financial earnings. One by one, these oil companies financial losses and debts continued to pile up.
And a perfect example, or the “Poster child”, of what is horribly wrong with the U.S. Shale Oil Industry is none other than Continental Resources.
Again, if you go to Continental Resources website, they proudly label themselves as “America’s Champion Oil Company”:
Maybe Continental was America’s oil champion at one time, however if we look at their financial results, they have been receiving some serious blows to their mid section. Looking at the company’s free cash flow since 2010, it isn’t a pretty picture:
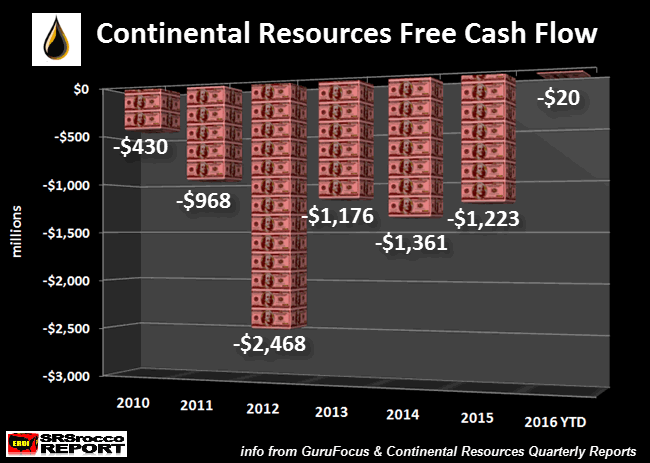
From 2010 to 2016 YTD (year to date – Q3 2016), Continental (ticker CLR) has spent a stunning $7.6 billion more on capital expenditures (CAPEX) than they made in operating cash. Of course this had a negative impact on their balance sheet. In that same time period, Continental’s long-term debt surged seven times higher from $926 million in 2010 to $6.8 billion in 2016 YTD:
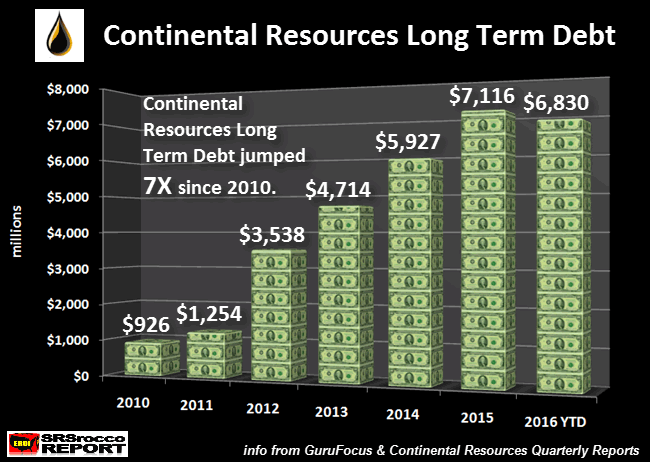
Continental’s long-term debt declined in 2016 partly due to the liquidating of their Washakie Basin leasehold properties in Wyoming. They used the sale of this asset to pay down their debt. While selling assets are a positive way to lower one’s debt, it could have a negative impact on the company’s ability to build or maintain future oil and gas production.
Moreover, for Continental to build oil production in the future, it has to spend even more money. Actually, this is exactly what Continental Resources has been doing ever since it jumped onto the Shale Energy Bandwagon. However, capital spending peaked in 2014 and has plummeted to lows not seen in more than six years:
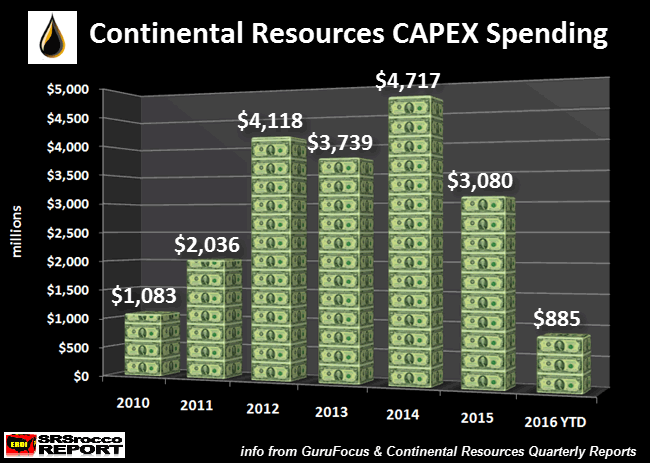
As we can see in the chart above, Continental’s CAPEX spending peaked in 2014 at $4,717 million ($4.7 billion), and declined to only $885 million 2016 YTD. How does Continental plan on maintaining or building oil production by selling assets or cutting its CAPEX spending by two-thirds? Maybe Continental can define gravity after all.
Also, it’s worth noting that the reason Continental Resources free cash flow (shown in the first chart above) declined to only a negative $20 million during the first three-quarters of 2016, was due to the oil company cutting its capital expenditures by more than $2 billion compared to the prior year.
Looking at the data in these charts, we can plainly see the CHAMP (Continental), is heading for serious trouble…. but it gets even worse.
There is this little financial metric called “Debt To Equity Ratio.” The debt to equity ratio shows us just how healthy a company’s balance sheet truly is. According to Investopedia’s definition of the debt to equity ratio:
Debt/Equity Ratio is a debt ratio used to measure a company’s financial leverage, calculated by dividing a company’s total liabilities by its stockholders’ equity. The D/E ratio indicates how much debt a company is using to finance its assets relative to the amount of value represented in shareholders’ equity.
So, what is Continental Resources debt to equity ratio? All I can say… it ain’t good:
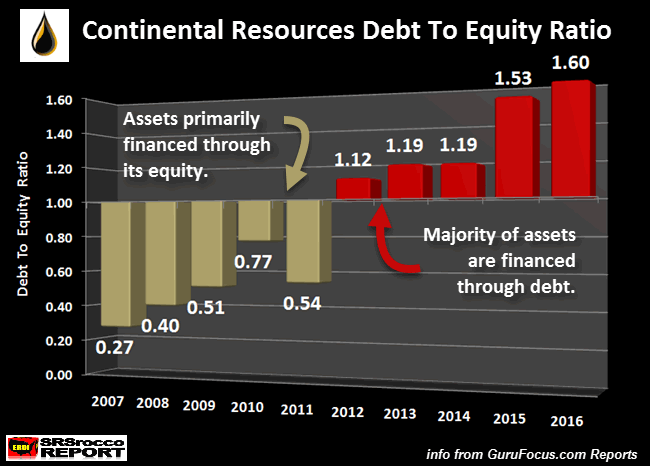
Again, to get the debt to equity ratio, we divide the company’s total liabilities by its shareholder equity (total liabilities minus total assets). A healthy debt/equity ratio is shown as a low number (olive color). When the debt/equity ratio climbs over “1” (red color), the majority of its assets are financed through debt.
David Dreman’s analysis for Continental’s debt to equity was as follows:
LOOK AT THE TOTAL DEBT/EQUITY: [FAIL]
The company must have a low Debt/Equity ratio, which indicates a strong balance sheet. The Debt/Equity ratio should not be greater than 20%. CLR’s Total Debt/Equity of 160.36% is not acceptable.
The Debt/Equity ratio of 160.36% corresponds with the 1.60 ratio shown in my chart above. Not only is Continental Resources debt/equity ratio above the number “1′ line in the sand, it is 60% higher. This is very bad news for America’s oil champion.
So, the question that many investors are wondering about… how is Continental financing all this debt they now have on their balance sheet. That is a great question. Actually, there is one more financial metric that gauges a company’s health by its “Interest Coverage.”
Interest coverage for Continental Resources defined by Gurufocus.com:
Interest Coverage is a ratio that determines how easily a company can pay interest expenses on outstanding debt. It is calculated by dividing a company’s Operating Income (EBIT) by its Interest Expense. Continental Resources Inc’s Operating Income for the three months ended in Sep. 2016 was $-93 Mil. Continental Resources Inc’s Interest Expense for the three months ended in Sep. 2016 was $-82 Mil. Continental Resources Inc did not have earnings to cover the interest expense. The higher the ratio, the stronger the company’s financial strength is.
Because Continental Resources operating income came in at a loss of $93 million for the third quarter of 2016, it couldn’t even pay the interest on its debt of $82 million that quarter.
The rule of thumb as it pertains to the interest coverage ratio, is that the higher the number the healthier the company’s balance sheet. Here is Continental’s interest coverage ratio going back until 2007:
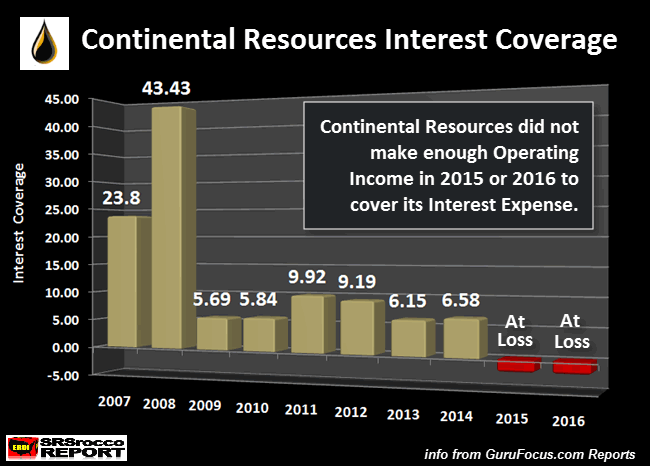
Here we can see that Continental experienced very high interest coverage ratios in 2007 and 2008… the time before it got NECK DEEP into the wonderful world of shale oil and gas production. As the price of oil and gas plummeted in 2015 and 2016, Continental’s operating earnings couldn’t even cover its interest on debt payments.
For example, in 2015, Continental had to fork over an interest payment of $313 to the kind and charitable Wall Street Banks. Unfortunately, it suffered an operating income loss of $224 million… thus it was unable to pay its interest on debt payment. Sadly, a company can’t pay its bills if it doesn’t make the profits.
Well, maybe things will get better for the U.S. oil champion once the disintegrating U.S. and global economies “magically” turn around and head back up in high gear. Then again… maybe it won’t.
If I had to put my money on it, I would wager the financial situation in the U.S. oil and gas industry will continue to get even worse. To make matters even worse, the East Cost petroleum gasoline inventories are at record levels. Refiners are not only turning away incoming tankers, they are now exporting gasoline.
Furthermore, Hedge Funds have never been this long in crude oil. When investors are seen to be piling into a trade in record numbers, normally this indicates a correction is likely. In addition, CNBC gadfly Dennis Gartman, stated he was “Going Long Oil.” Anyone familiar with Dennis Gartman’s track record, is that when he makes a call on the direction of the stock, bond or commodity, the opposite usually occurs.
So, if the fundamentals are pointing to a WEAKENING oil market, logic suggests the oil price will head lower. Thus, lower oil prices will only add more pain to an industry that is already suffering a great deal of trouble and misery.
That being said, I have nothing against Continental Resources or the people who work at the company. Most are probably doing the best they can to provide much-needed oil to Americans. However, the deteriorating financial situation at Continental can not be ignored.
I would imagine in less than five years, the U.S. oil industry will resemble nothing like it is today. This is extremely bad news for a country that has one hell of a large SUBURBAN LEECH AND SPEND ECONOMY that can only survive if the oil continues to flow.
IMPORTANT NOTE: I will be publishing a very interesting article this week on how the gold market has been controlled and manipulated since Nixon dropped the Gold-Dollar peg in 1971.
Check back for new articles and updates at the SRSrocco Report. You can also follow us at Twitter, Facebook and Youtube below:


2016 Copyright Steve St .Angelo - All Rights Reserved Disclaimer: The above is a matter of opinion provided for general information purposes only and is not intended as investment advice. Information and analysis above are derived from sources and utilising methods believed to be reliable, but we cannot accept responsibility for any losses you may incur as a result of this analysis. Individuals should consult with their personal financial advisors.
© 2005-2022 http://www.MarketOracle.co.uk - The Market Oracle is a FREE Daily Financial Markets Analysis & Forecasting online publication.