


Median US Household’s Wealth Has Declined by 40% Since 2007
Economics / Demographics Apr 21, 2017 - 03:38 PM GMTBy: John_Mauldin

 Nominal US household wealth is at an all-time high. But my friend Marc Faber (publisher of the Gloom Boom & Doom Report) says that's mostly an illusion.
Below, Marc looks at the relationship between asset prices and US household wealth, and the effect of that relationship on the economy.
It seems the wealth of the top 0.1% has vastly improved in recent decades (and the top 10% haven’t done at all badly). But “the median household’s or asset owner’s wealth has declined by close to 40% in real terms (adjusted by the CPI) from its peak in 2007.”
Median household increases in wealth are also illusory because the main component of household wealth is pension fund assets (approximately US$22 trillion).
Marc spends considerable time on this point, because—as I have regularly noted in Thoughts from the Frontline (subscribe here for free)—pension underfunding is dire and getting worse.
Marc also points out that a large chunk of household wealth is held in the form of owner-occupied homes. But these assets are, on average, cash-flow negative. This is due to taxes, maintenance costs, mortgage payments, etc.
Further, if your home’s nominal value has appreciated (by, let’s say, 300% in 30 years) and you now sell and then go to buy a home of similar quality elsewhere, the home you’re shopping for will most likely have also appreciated. That wipes out your so-called 300% gain.
The top 0.1% of US households own more than the bottom 90%. It’s this ever-growing disparity between the super-wealthy and the average citizen—and its overall impact on the economy—that most troubles Marc.
The Influence of Affluence
By Marc Faber
Excerpted from the Gloom, Boom & Doom Report for April 2017
“For as wealth is power, so all power will infallibly draw wealth to itself by some means or other.”
– Edmund Burke (1780)
“Of great riches there is no real use, except it be in the distribution.”
– Francis Bacon (De Dignitate et Augmentis Scientiarum, 1623)
“That mankind as a whole shall become richer does not, of necessity involve an increase in human welfare.”
– John Bates Clark
“Riches: The saving of many in the hands of one.”
– Eugene V. Debs
Those persons who comprise the independent classes are dependent upon two things: the industry of their fellow creatures; and injustice, which enables them to command it.
– Based on John Gray (A Lecture on Human Happiness, 1825)
“No rich man is ugly.”
– Zsa Zsa Gabor
Introduction
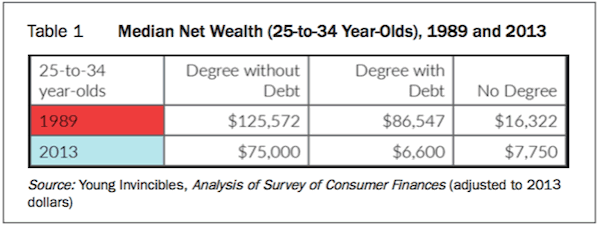
The other day, I was interviewed by CNBC. One of the participants on their panel asked me whether I believed I was providing a service to investors by warning them that stocks could decline by between 20% and 40%, or even more. He further questioned my morality in dissuading investors from buying stocks that were being touted as a once-in-a-lifetime opportunity to make money following their March 2009 lows. Aside from the inaccuracy of the interviewer’s statement that I had been keeping investors out of the market, I was taken aback by the notion of a CNBC employee talking about morality. Every year, I attend several conferences and Hillary Clinton about ethical behaviour, Trump about modesty and unpretentiousness, Bernanke and Yellen about “honest money”, and mobster Whitey Bulger about mercy. (Federal prosecutors indicted Bulger for 19 murders.) Still, the question prompted me subsequently to contemplate whether periods of high monetary inflation (printing money) make people wealthier in real terms. Last month, I explained that it is an irrefutable fact that inflation-adjusted millennials earn less, and have less wealth, than the baby boomers had at the same age. (See Table 1 for easy reference.)
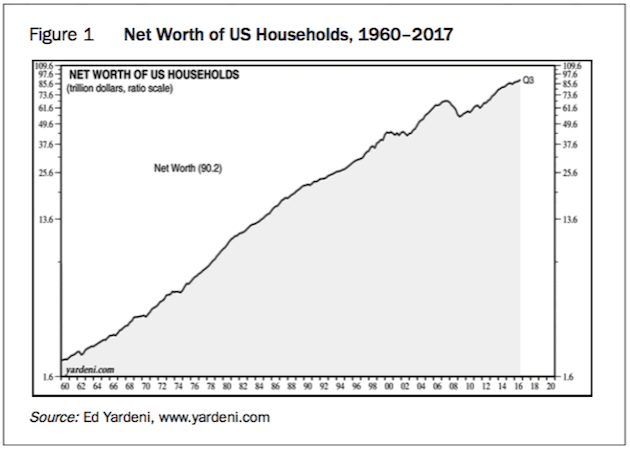
Also, it is true that US household wealth is at an all-time high – certainly in nominal terms (see Figure 1). (As an aside, Ed Yardeni publishes very useful figures about US and global “Flow of Funds”.)
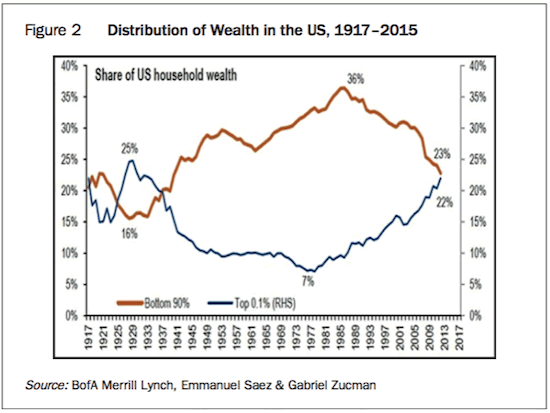
But, as I have explained in the past, the distribution of wealth has become more unequal, with the 0.1% (the super-wealthy) doing extremely well, while the median household’s or asset owner’s wealth has declined by close to 40% in real terms (adjusted by the CPI) from its peak in 2007 (see Figure 2). I now wish to make some further observations about the increase in household wealth, in both nominal and real terms, of the 0.1%.
The Wealth Illusion
Say I own a nice property in Beverly Hills, Newport Beach or Palm Beach. I bought the property 15 years ago for US$1 million. It’s now worth US$10 million. Over the same period, the CPI is up by 25%. Therefore, adjusted for inflation, my house has appreciated by 75%, correct? Not so fast. First of all, the cost-of-living increase over that period of time has been far greater than the CPI indicates (and includes taxes, home maintenance costs, school fees for my children, salaries of my housekeepers – that is, unless I’m a member of Congress who employs illegals).
So, the real wealth increase, even measured by an index of consumption-related expenditures, may be far lower than that which is deflated by the official CPI. Furthermore, let us assume that I decide to sell my US$10 million house in Beverly Hills with the intention of buying another house in Palm Beach, Newport Beach, San Francisco, or an equivalent location. What will I pay for that house? I suppose it will be something like the inflated price at which I’m selling my existing home. I invite a statistician to explain to me what is a more appropriate index against which to measure the price of my house: the CPI, or an index of property values in an equivalent location?
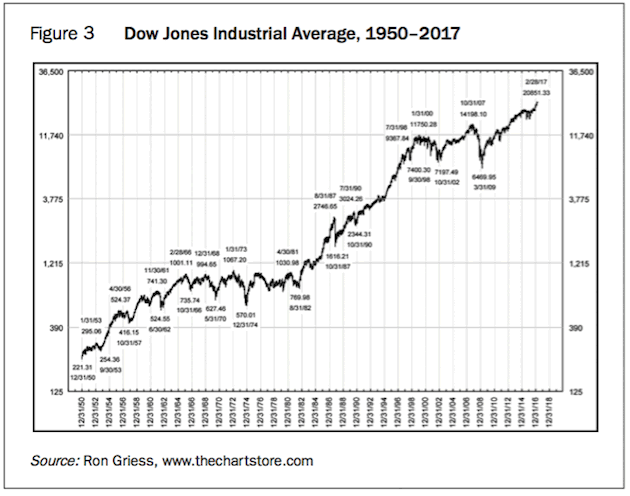
Measured against the CPI, my house has appreciated; however, measured against a property price index it may have gone up somewhat more, or somewhat less, than the index, depending on how the prices of other homes comparable to my house have moved in the same location. Now, someone might argue that, regardless, I would have done very well compared to the median US household and the 50% of Americans who have no assets at all. That argument is correct. In an asset inflationary environment, asset holders do far better than people who don’t own any assets. (The same is true in a consumer price inflationary environment such as we had in the 1970s.) But my point is that, unless, after selling my US$10 million house, I move to an area that has appreciated only very little or has even gone down in price, in reality I have no net wealth gain. I concede that I could move to Mexico City, Rio de Janeiro, Bahia, New Orleans, Bali, Pattaya, Maputo, or a similar location, and purchase a house equivalent to the Beverly Hills house that I’ve just sold, but for a fraction of the price. In some places, I might even improve my standard of living meaningfully. But in other locations, the environment may not be to my liking at all. The point I wish to make is that my wealth increase as represented by the Beverly Hills house is largely illusionary, unless I sell that expensive property and move to a far less expensive area. The same would be true of an investment in the stock market. In the 1970s, I could buy the Dow Jones Industrial Average for less than 1,000. Now, I need to pay 21,000 for one Dow Jones, which is 21-times what I would have paid in the seventies (see Figure 3). Over the same period of time, US household wealth has increased by about the same amount (see Figure 1).
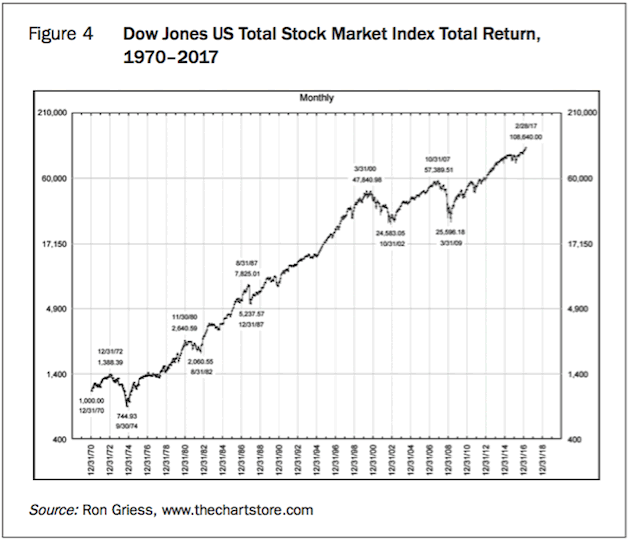
Naturally, the total return of the stock market (including reinvestment of dividends) over the same period was far higher. The Dow Jones US Total Stock Market Index appreciated more than 100-fold between 1970 and 2017 (see Figure 4). (The Dow Jones US Total Stock Market Index is an all-inclusive measure composed of all US equity securities with readily available prices.) The total returns of other indices such as the S&P 500 and the Dow Jones Industrial Average are of a similar magnitude, whereby value outperformed growth over the entire period.
There are several reasons why household wealth increased far less than the total return of the stock market. The main component of household wealth is pension fund assets (approximately US$22 trillion). Since pension funds hold a diversified portfolio of assets consisting of stocks, bonds, cash, real estate, alternative investments, etc., they underperformed the total return of a stock portfolio. Households also have large real estate holdings in the form of owner-occupied homes. Owner-occupied homes are a cash-flow negative asset (taxes, maintenance costs, mortgage payments, etc.). The value of these (cash-flow negative) homes has appreciated since 1970; however, they have appreciated (with few exceptions) far less than have stocks whose dividends were reinvested. The same goes for households’ holdings of bonds and cash, and their own businesses. The value of households’ direct ownership of equities increased at about the same rate as household wealth, but at a far lower rate than the total return of equities because households tended to be net sellers of equities. I assume that households felt increasingly comfortable holding the bulk of their wealth in pension fund assets and, therefore, reduced their direct ownership of equities.
Still, there is no question that US household wealth has increased significantly since the 1970s (see Figure 1). But, can we say that the record US$89 trillion wealth of the household sector is an indication of how well the economy is performing? Furthermore, can we conclude that when a part of this household wealth is liquidated, a huge consumption and economic boom will follow? The answer to the first question is simple. Most of the increase in household wealth accrued to a tiny percentage of the population (see Figure 2). In fact, following the Trump rally, the top 0.1% of households own more than the bottom 90%. Also, as I explained above, the increase in value of my Beverly Hills house is of limited utility if I wish to continue living in an equivalent house in an equivalent area somewhere else. We then need to consider the increase in the US population, which in 1970 was 205 million and is now 318 million.
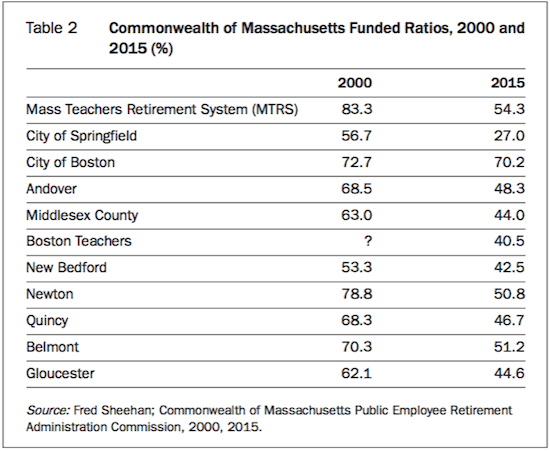
Therefore, a better indication of American wealth than total household wealth would be per-capita wealth. Lastly, as I explained above, the largest component of US household wealth is pension fund reserves, currently valued at US$22 trillion. But there are some question marks over these assets and whether they are really worth this amount. Last October, my friend Fred Sheehan (frederick.sheehan@verizon. net) explained just how underfunded pension funds were, citing (among other examples) the Commonwealth of Massachusetts Funded Ratios (see Table 2).
In this respect, it’s interesting to note that The New York Daily News recently carried an article about the Teamster Local 707’s pension fund (see February 26, 2017), which has encountered serious financial problems. According to the Daily News, one trucker reported: “It’s a nightmare, it has just devastated all of our lives. I’ve gone from having $48,000 a year to less than half that.” Again according to the Daily News, another Teamster pensioner, Narvaez, explained that:...like 4,000 other retired Teamster truckers, [he] got a letter from Local 707 in February of last year. It said monthly pensions had to be slashed by more than a third. It was an emergency move to try to keep the dying fund solvent. That dropped Narvaez from nearly $3,500 to about $2,000.
The stopgap measure didn’t work – and after years of dangling over the precipice, Local 707’s pension fund fell off the financial cliff this month. With no money left, it turned to Pension Benefit Guaranty Corp., a government insurance company that covers pensions.
Pension Benefit Guaranty Corp. picked up Local 707’s retiree payouts – but the maximum benefit it gives a year is roughly $12,000, for workers who racked up at least 30 years. For those with less time on the job, the payouts are smaller.
Narvaez now gets $1,170 a month – before taxes. Ex-trucker Edward Hernandez, 67, went from $2,422 a month to $1,465 last year. As of this month, his gross check is $902. After federal taxes, it’s $721 – but he still has to pay state and city taxes.
“We have guys on Long Island who are losing their houses, the taxes are so high out there,” Hernandez said. Milton Acosta, 75, was a dockworker in Local 707. He retired at age 62, figuring his union pension of $2,300, coupled with his Social Security, would keep him and his wife afloat. Now his pension is $760 a month after taxes, he said.
As heartbreaking as their stories are, they are not new to Thomas Nyhan, executive director and general counsel of the Central States Pension Fund.
The same crisis now hitting Local 707 has been stewing among numerous Teamster locals around the country for the past decade, he said, and that includes in upstate New York. The trucking industry – almost uniformly organized by Teamsters – has suffered enormous financial losses in its pension and welfare funds due to a crippling combination of deregulation and stock market crashes, Nyhan said.
“This is a quiet crisis, but it’s very real. There are currently 200 other plans on track for insolvency – that’s going to affect anywhere from 1.5 to 2 million people,” said Nyhan. “The prognosis is bleak minus some new legislative help.” And it’s not just private-sector industries that are suffering, he added.
“Municipal and state plans are the next to go down – that’s a pension tsunami that’s coming,” he said. “In many states, those defined benefit plans are seriously underfunded – and at the end of the day, math trumps the statutes.” [Emphasis added in each instance.]
(As an aside, Illinois is facing the worst pension crisis of any US state, with unfunded obligations totalling US$130 billion, according to the state’s Commission on Government Forecasting and Accountability. That amounts to about US$10,000 in debt for each resident.)
I urge my readers to peruse once again Fred Sheehan’s report, entitled “Public Pension Recipients: Start Saving. You Are on Your Own”, in the October 2016 GBD report. I explained at the time that the shocking funding level and its deterioration (see Table 2), about which Sheehan writes, is also evident in the corporate sector and in Europe. So, whereas prior to the 2008/2009 crisis S&P 1500 companies were fully funded, today funding has dropped below 80% (see Figure 7 of the October 2016 GBD report). I also noted that I found the deteriorating funding levels of pension funds remarkable because, post-March 2009 (S&P 500 at 666), stocks around the world rebounded strongly and many markets (including the US stock market) made new highs. Furthermore, government bonds were rallying strongly after 2006 as interest rates continued to decline. My point was that if, despite truly mouth-watering returns of financial assets over the last ten years, unfunded liabilities have increased, what will happen once these returns diminish or disappear completely? After all, it’s almost certain that the returns of pension funds (as well as of other financial institutions) will diminish given the current level of interest rates and the lofty US stock market valuations (see Figures 12 and 13 in the March 2017 GBD report).
The Road to Perdition
The next time an economist tells you that the US economy is rock solid because household wealth keeps going up and is now almost US$93 trillion (following the Trump rally), keep in mind that this wealth is unevenly distributed (see Figure 2) and that the US$22 trillion in the form of pension funds is completely inadequate to meet those funds’ obligations to pensioners. Either contributions will have to increase massively, or benefits will have to be cut, as we have seen in the case of the Teamster Local 707’s pension fund. I should also like my readers to reflect on the hardships that have to be endured by retirees if their benefits are cut by more than 50%, as we have seen in the examples quoted above by the Daily News. Furthermore, if, as Thomas Nyhan states, there is a quiet but very real crisis “that’s going to affect anywhere from 1.5 to 2 million people” (probably far more than that number nationwide), consider what the impact on consumption and the US economy will be.
There is another point I need to explain. Let us assume that I belong to the 0.1% and that I have assets of US$100 million. Because of the Trump rally, I make a profit of US$5 million within a month. Will it change my consumption? Maybe at the margin (the trickle-down effect), but very little overall, compared to a thousand lower middle-class people suddenly making an additional US$1,000 each. In that case, it’s likely that the 1,000 people who enjoy a sudden “monetary” windfall of US$1,000 will spend most of it. Therefore, if wealth is concentrated in the hands of very few people, as it is now, the economic impact of household wealth rising is minimal. In other words, the level of household wealth is a very poor indicator of how the economy is really performing. This is especially true in a money-printing environment.
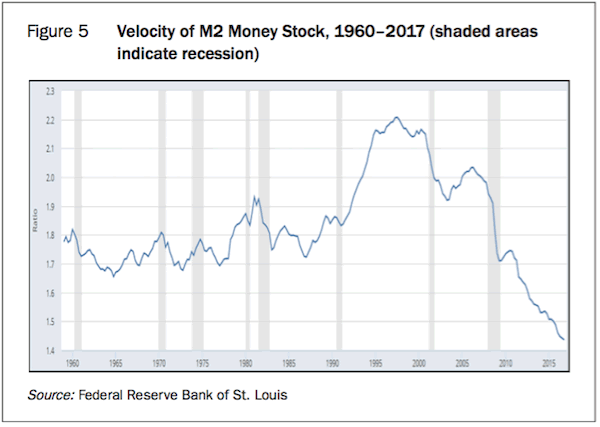
In this context, I need to clarify another matter. Most economists have argued that inflation is low and growth is anaemic because the velocity of money has been declining since the late 1990s (see Figure 5). These economists will argue that when the velocity of money picks up, inflation and growth will accelerate. But how can velocity accelerate? Let us go back to Figure 2. The top 0.1% of asset holders (the super-rich) will unlikely spend their wealth if they liquidate some assets. Let’s say that Warren Buffett makes another US$1 billion because of the Trump rally. Will he spend that money? It’s unlikely. He might reduce his equity exposure and build up his cash holdings or buy some other assets, but his billion- dollar capital gain isn’t going to cause him to go out and buy another 50 tailor-made suits, neckties and sets of silk pajamas. In other words, the Fed and other central banks can further increase their balance sheets, which will boost asset prices still higher. However, it will only worsen the wealth inequality because only the existing asset holders will benefit, and it will further deflate the velocity of money (see Figure 5). (In fact, just how little impact the rising US stock market has had on the economy is evident from the TDn2K’s Restaurant Industry Snapshot, which announced that restaurant “same-store sales fell –3.7 percent in February, with traffic declining –5.0 percent.... Fine dining and upscale casual were the strongest segments in February. Fine dining was the only segment up overall.” But please note that “fine dining” only accounts for 5% of restaurant sales. The report added: “Consumers are spending, but they are being battered by rising inflation.”)
There are, however, three ways in which the velocity of money could be increased. A complete collapse of asset markets would bring about deflation and improve the affordability of goods, services and assets for the median household – certainly relative to the 0.1%. In this scenario, the velocity of money will increase, but I very much doubt that the increase in velocity would bring about stronger growth and higher inflation.
A massive dose of helicopter money dropped on the 50% of Americans who are struggling and have no assets would probably be the most potent tool for boosting the velocity of money, inflation and economic growth – that is, temporarily. I say “probably” and “temporarily” because it is far from certain that this intervention would improve “real” economic activity and “real” growth. Also, “Helicopter Money One” would have to be followed by “Helicopter Money Two”, and so on, which would have numerous very negative consequences (a collapse in the dollar, very high consumer price inflation rates, further increase in wealth inequality, etc.). The third option for boosting the velocity of money would be to expropriate a significant share of the wealth of the top 0.1% of wealth owners and distribute it to the 50% who are the lowest-income recipients. Again, this would boost consumption only temporarily and it would be a complete disaster for the overall economy. Disturbingly, this is what will be the ultimate outcome unless an authoritarian dictator seizes power, in which case the outcome could be even worse.
Let me explain. Should the economy weaken and enter another recession (which is inevitable, sooner or later), QE4 will be a given. The result of QE4 would be more of the same: rising wealth inequality as asset prices continue to increase (this time, very selectively) whereby the median household is left further behind. Therefore, the next step by the interventionists will be – possibly simultaneously with QE4 – helicopter money. However, make no mistake. Helicopter money whose objective would be to kick-start the economy would be almost instantly captured by the powerful corporate sector and the asset owners, because the increased consumption would increase consumer prices and boost corporate profits. In other words, unless the interventionists with their fiscal and monetary policies engineer an asset price collapse (about the last thing they will do intentionally), the top 0.1% will continue to gain at the expense of just about everybody else. Don’t misunderstand me. I am not blaming the 0.1% for snatching an increased share of the income and wealth pie. They were in a better position and more able to take advantage of globalisation and monetary inflation than the vast majority of Americans. Moreover, their wealth allowed them to manipulate governments, their agencies, the lawmakers and regulators, etc. (especially central banks and treasury departments) for implementing policies that would greatly benefit them. Thus, their share of the wealth and income pie exploded (see Figures 2 and 6).
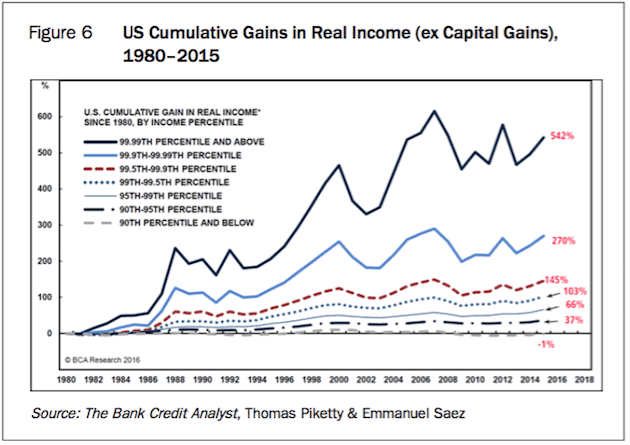
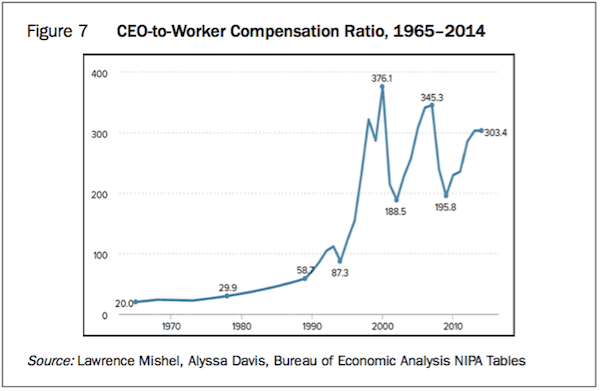
I admit that the statistics compiled by Thomas Piketty and Emmanuel Saez should be taken with a grain of salt, but the expansion of CEOs’ salaries relative to the salaries of workers does support the fact that the 0.1% have done very well compared to workers (see Figure 7). According to the Bureau of Economic Analysis, CEOs of the largest US companies now earn more than 300 times what workers earn, compared to CEO salaries of less than 30 times what workers earned in the 1970s. (The Bureau of Economic Analysis computes CEO annual compensation by using the “option realised” compensation series, which includes salary, bonus, restricted stock grants, options exercised, and long-term incentive payouts for CEOs at the top 350 US firms ranked by sales.)
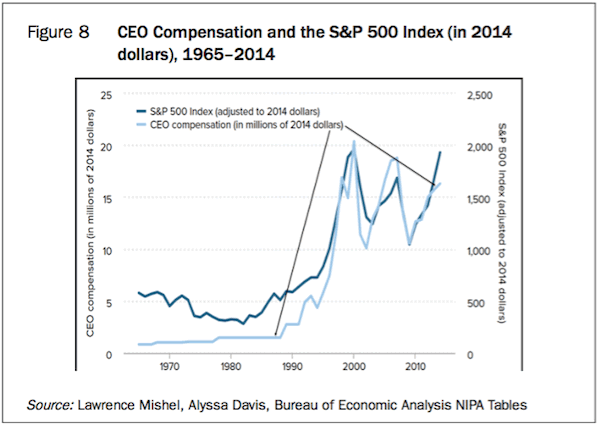
Above, I mentioned that wealthy people, including the CEOs of major companies, were in a better position and more skilful at taking advantage of globalisation and monetary inflation than the vast majority of Americans. Monetary inflation, the secular decline of interest rates after 1981, the process of outsourcing, clever lobbying, etc. all contributed to rising corporate profits, which in turn allowed executives to boost their compensation without any objection from shareholders. In fact, we can see that CEOs’ compensation increases mirror the increase in the S&P 500 (see Figure 8). I want to stress that I have no idea whether CEOs should earn 30 times more than workers or 500 times more. (I also earn more than 500 times the salaries of my housekeepers in Chiang Mai, which difference can be partly explained by them earning a Thai local salary whereas I have an international income.) The fact is that, in a market economy, the market will determine the “price” of CEOs and of labour. But, as I said above, I suppose that wealthy people and corporate leaders (especially in the financial sector) were in a position to manipulate the system, which enabled them to heist a disproportionally large share of the economic pie. When money printing began to accelerate in and after the late 1990s, the financial sector managed to raid almost all the central banks’ newly printed money and some more ... with impunity. (According to the organisation Americans for Financial Reform, “in the 2015–16 election cycle, Wall Street banks and financial interests reported spending over $2.0 billion to influence decision- making in Washington. That total — of officially reported expenditures on campaign contributions and lobbying — comes to more than $2.7 million a day. It also works out to over $3.7 million per member of Congress.”
We have a system in place that is based on fiscal and monetary policies, and laws and regulations, that favour the corporate elite, the largest corporations, the captains of finance, and the 0.1% in general, because they are the asset holders. This moneyed class will not give up its privileges voluntarily. The privileged class will
do everything in their power to keep these favourable conditions in place, which would include money printing in one or another form if there is a recession or if asset markets decline meaningfully (say, to the February 2016 low of 1,810 for the S&P 500). As I said, I’m not discussing these issues because I have some rancour about these “conditions” from which
I actually profiteered greatly. I am discussing them because I believe
that an unstable system in which
the majority of people lose out to
the privileged few is simply not sustainable and will end either with a Bernie Sanders-type socialist gaining power or with the establishment of a dictatorship. Democracies promised a level playing field in society, but that certainly does not seem to be in place nowadays. I suspect that we have never yet had a level playing field, but I feel that we are reaching a tipping point where something is likely to give, and I am afraid that this “something” could be the inflated asset markets.
Get Varying Expert Opinions in One Publication with John Mauldin’s Outside the Box
Get Varying Expert Opinions in One Publication with John Mauldin’s Outside the Box
Every week, celebrated economic commentator John Mauldin highlights a well-researched, controversial essay from a fellow economic expert. Whether you find them inspiring, upsetting, or outrageous… they’ll all make you think Outside the Box. Get the newsletter free in your inbox every Wednesday.
John Mauldin Archive |
© 2005-2022 http://www.MarketOracle.co.uk - The Market Oracle is a FREE Daily Financial Markets Analysis & Forecasting online publication.