


Gold Bounce from Oversold Levels
Commodities / Gold & Silver Aug 27, 2008 - 12:59 AM GMTBy: Merv_Burak

Gold was basically in a bounce mode this past week but unfortunately closed on the down side on Friday. It needs a lot more upside activity or lateral strength building to prove that it is back on a roll.
GOLD - LONG TERM : Although the week was somewhat positive nothing from the long term has changed. The message of the P&F chart has remained as shown last week although we now have a column of 4 Xs.
The very long term rating, as mentioned last week, remains bearish. As for the normal charts and indicators, gold remains below its negative sloping long term moving average line while the long term momentum remains just below its neutral line in the negative zone. The volume indicator, although still not as weak as the other indicators, is below its negative sloping trigger line. The long term rating remains BEARISH .
INTERMEDIATE TERM
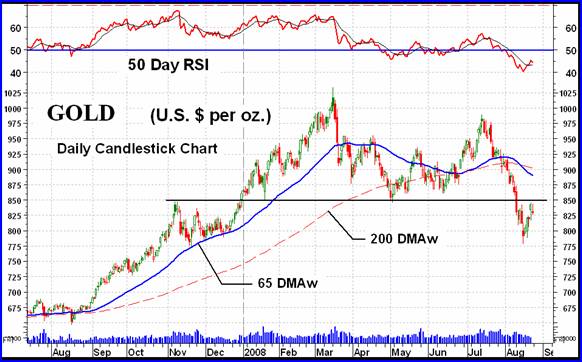
You would expect a little more excitement in the intermediate term than the long term, and here we have it (emphasis on “little”). Over the past several months we had a fairly good support level that was broken a couple of weeks back. That activity over the past several months has given us a double top pattern. The break below support was the breaking of the double top projecting, by this method, down to about the 670 level. That seems to confirm the $660 level that I mentioned last week based upon the long term P&F break. Technicians will see the bounce this past week as nothing more than a reflex following a break. It is not unusual in these breaks (as well as in head and shoulder breaks) that the price should rally back to the previous support (now a resistance) line before continuing on its downward way. You can also see that the bounce started from the same level that the previous (Nov 2007) bounce started. Something to watch is to see if this area from $775 to $850 ends up to be an opposite to the Nov 2007 area action, i.e. sideways and then lower.
As for our normal charts and indicators, gold remains below its negative sloping moving average line and it would take another one or two weeks of action such as this week to change that. The intermediate term momentum indicator remains in its negative zone but has moved above its trigger line and the line has now turned very slightly to the positive side, so, one would call it a negative rating but moving positively. The volume indicator has perked up a bit but is still below its intermediate term negative trigger line. All in all there is no reason yet to improve the BEARISH rating.
SHORT TERM
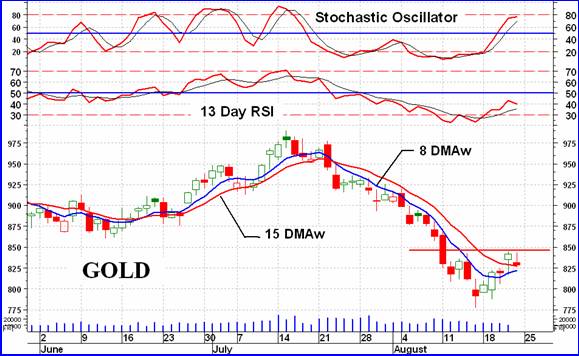
You can see the bounce back to the resistance (previously a support) line on the short term chart. The Friday action looks very much like a reversal action but most of my Candlestick books say to wait for confirmation the next day, that would be Monday.
We see the aggressive Stochastic Oscillator was firming up for a week before finally breaking above its oversold line on Monday. The short term momentum broke above its line on Monday also. Both indicators are above their positive sloping trigger lines but while the SO in well inside its positive zone the momentum is still inside its negative zone. Gold is above both short and very short term moving average lines but only the very short term line has turned upwards. We have a short term that is rated as + NEUTRAL while the immediate direction is upwards but in trouble of getting reversed with only a minor amount of negative gold action.
SILVER
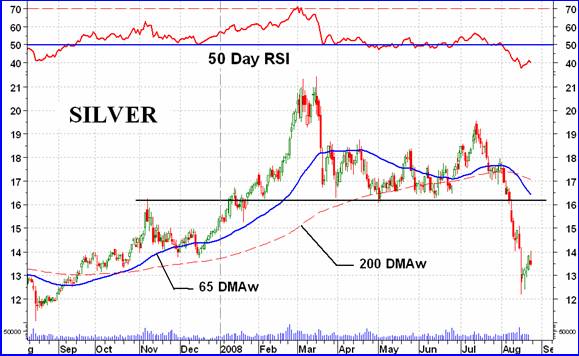
The silver drop has been more pronounced than the gold recent drop, although neither one would be invisible to chart watchers. The major difference between the two moves is that gold had given advance warning of the March top being weak by the weakness in its momentum indicator while silver momentum gave no such advance warning. The subsequent momentum action was similar to the gold action except that after the latest break to the down side in the beginning of August the silver weakness has been considerably greater than the gold weakness. The price drop in silver has also been more severe. The bounce this past week came nowhere near its high of the previous week while for gold its bounce exceeded its previous week's high, if only by a little. It's interesting to note that silver is rated with Relative Strength weaker than gold for all three time periods (see Table) but more interesting is the direction of the Relative strength. Gold RS is improving versus the table list while silver is getting weaker versus the list, this for all three periods. Silver is still not the place to be. Gold isn't either but it is somewhat stronger than silver at this time.
PRECIOUS METAL STOCKS
Looking over the charts of the various Merv's precious metal indices the only conclusion one gets is that they are not pretty charts. Bummers, all of them. The various Tables of Technical Information and Ratings confirms the story. For the universe of 160 stocks in the Merv's Gold & Silver 160 Index only 9% are rated as bullish on the intermediate term and only 6 are on the long term. Similar results can be seen for all the Indices (available to subscribers at the Merv's Precious Metals Central at http://preciousmetalscentral.com ). The Merv's Qual-Silver Index has zero stocks rated as bullish so that group has only one way to go and that is up. Also telling is that out of the 14 stocks, in the 160 group, with positive performance over the past 50 days (intermediate term) 6 of them have their performances moving in a negative direction. We are going to need considerable more upside action, or lateral strength building action, before the precious metal stocks once again start to look good. That time will come but one just has to be patient and not get too cocky ahead of time. There could still be significant losses ahead. If we are in the early stages of a turn around phase there will be plenty of time to get in and profit once the turn has been verified.
Merv's Precious Metals Indices Table
Well, that's it for this week.
By Merv Burak, CMT
Hudson Aero/Systems Inc.
Technical Information Group
for Merv's Precious Metals Central
For DAILY Uranium stock commentary and WEEKLY Uranium market update check out my new Technically Uranium with Merv blog at http://techuranium.blogspot.com .
During the day Merv practices his engineering profession as a Consulting Aerospace Engineer. Once the sun goes down and night descends upon the earth Merv dons his other hat as a Chartered Market Technician ( CMT ) and tries to decipher what's going on in the securities markets. As an underground surveyor in the gold mines of Canada 's Northwest Territories in his youth, Merv has a soft spot for the gold industry and has developed several Gold Indices reflecting different aspects of the industry. As a basically lazy individual Merv's driving focus is to KEEP IT SIMPLE .
To find out more about Merv's various Gold Indices and component stocks, please visit http://preciousmetalscentral.com . There you will find samples of the Indices and their component stocks plus other publications of interest to gold investors.
Before you invest, Always check your market timing with a Qualified Professional Market Technician
Merv Burak Archive |
© 2005-2022 http://www.MarketOracle.co.uk - The Market Oracle is a FREE Daily Financial Markets Analysis & Forecasting online publication.