


Stock Market Cycles Analysis Suggests Final Low by October
Stock-Markets / US Stock Markets Aug 28, 2008 - 06:41 AM GMTBy: Andre_Gratian

 Current Position of the Market
Long-term trend - The Dow Jones Industrials may be deviating from their typical decennial pattern in an election year. Important cycles going into the Fall could be the reason for this, but one also has to consider the possibility that the downward pressure from the 120-yr cycle, which is due to make its low in 2012-2014, has begun to take effect and that October 2007 was the top of the bull market. This is not yet confirmed and remains a low probability.
SPX: Intermediate trend - It is possible that the intermediate term correction was completed at 1201. More likely, this is only a counter-trend rally which may be near an end with the final low in September or October.
Analysis of the short-term trend is done on a daily basis with the help of hourly charts. It is an important adjunct to the analysis of daily and weekly charts which determines the course of longer market trends.
Daily market analysis of the short term trend is reserved for subscribers. If you would like to sign up for a FREE 4-week trial period of daily comments, please let me know at ajg@cybertrails.com .
Overview:
"What the indices all have in common is that they are getting overbought and may be in need of a correction. The poor quality of breadth and the relatively low volume in this rally are proof of the underlying lack of demand for stocks. Next week will be critical in determining the course of the short-term trend. If we cannot extend the move which started on Friday morning, the market is at risk of making a reversal which will lead to additional consolidation and perhaps new lows in the weakest indices over the next few weeks."
This was written in the last newsletter and, on the next day, the market did start a correction which came to an end last Thursday. During this retracement, the weakest index, the NYSE came very close to its July low, while the strongest, the Nasdaq 100 had a much needed pullback. By the end of the week, the market as a whole was attempting to get back into an uptrend. If it succeeds, it will probably not be for long for a couple of reasons: 1) The correction was not deep enough to relieve the short-term overbought condition of the market, 2) Breadth remains anemic.
Perhaps a more compelling reason is that the 6-yr cycle low which is due in the Fall, is getting closer and closer and will exert increasing downward pressure on prices.
Finally, oil still has not had a decent counter-trend rally after its 20% correction, and it will shortly be ready to resist and reverse its downtrend. In fact, it may already have found a temporary low and is in the process of testing it.
What's ahead?
Chart pattern and momentum:
The SPX is still in an intermediate downtrend and will continue to be as long as it stays within the heavy red lines which delineate the parameters of the intermediate down-channel.
On July 15th, the index found a temporary low at 1201 and started a corrective uptrend. There is a chance that this upward correction came to an end in mid-August at 1313. The first retracement stopped on a channel line and produced a 2-day bounce into Friday. This bounce could become an extension of the rally and make a new high before it reverses. There is an unfilled projection to about 1220-25, and if Monday sees the SPX move decisively beyond 1302, it would trigger a confirming projection to the same level.
There are small obstacles that will have to be overcome. Resistance will come from three different areas: The underneath of the minor uptrend line which was just broken, the former high of 1302, and the declining internal upper channel line (red dashes). If the index can get above all that, it will re-establish its uptrend, and could reach its stated target.
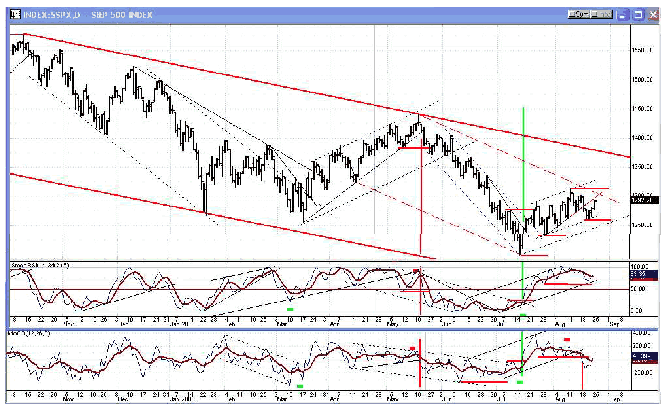
The two indicators at the bottom of the chart are saying that we may already have made a top, or are close to doing so. The breadth oscillator (lower) has already given a sell signal by coming out of its channel, but the momentum index has not. This is negative divergence and not the sign of a strong market.
Cycles
Two cycles are responsible for the current rally. The 2-yr and the 9-mo cycles. They are going against the bottoming trend of the 6-yr cycle which is getting very close to making its low. Mid- October seems like a reasonable time frame.
I suggested earlier that we may also be under the influence of a 7-year cycle whose previous lows would have been 1987, 1994, 2001, and now 2008. Seven years from its September 2001 low would be 9/16/08.
The 6 and 7-yr cycles could combine to bring about a sharp decline over the next few weeks which would put an end to the intermediate decline and resume the bull market uptrend.
Projections:
"The move down from 1440 still has an unfilled projection to 1180 or below. The rally from 1201 barely reached a .382 retracement on Friday. It may not go much higher without additional consolidation. A 50% normal retracement would take it to 1320. Anything less has to be considered weak."
Neither projection has been reached yet. From where the SPX sits, we could easily first satisfy the upper projection, and then the lower one. As mentioned above, trading decisively above 1302 would trigger a potential projection to 1320-25.
In my closing comment on 8/19 I wrote "...This favors a little more selling tomorrow morning to the target zone before we reverse. 1262 would be ideal."
The next day, the SPX printed 1261.16 and reversed. After another day of consolidation, it started to rally and closed on Friday at 1292.20. During that consolidation, the Point & Figure chart made a small base which had two distinct phase counts. The first to 1295 and the other to 1301.
The first was filled on Friday and brought a pull-back to 1284. The second could be filled on Monday and bring an end to the rally. By stretching the rules of P&F counting, it would be possible to produce a much less reliable count to 1325, which would fit with the Fibonacci projection that would be triggered if the SPX rises above 1302.
Breadth
The daily breadth oscillator peaked in the 4th week of July and has been in a declining trend ever since, producing a series on negative divergence tops vs. the SPX price. On 8/18, it finally gave a sell signal and in the last couple of days it has tried to re-establish its uptrend.
If we are to have a strong continuation of the rally, breadth will have to be far more positive than it has been over the past month.
Market Leaders and Sentiment
Market strength is represented by the NDX and Russell 2000 which continue to outperform the SPX, although during the recent correction, they were slightly weaker. The NQ breadth has also become relatively weaker than the SPX over the short-term. This is a sign that we are approaching the end of the rally.
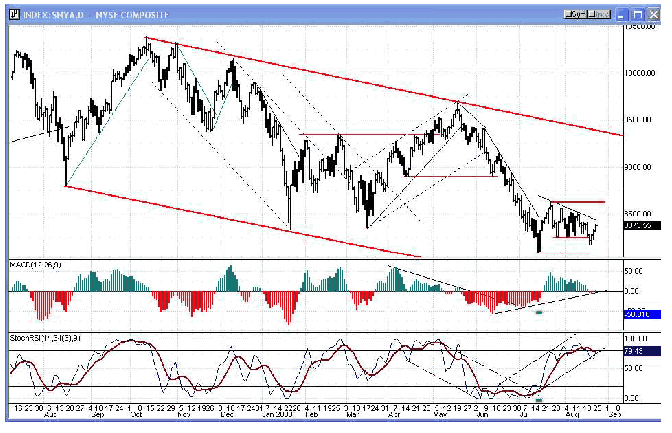
The underlying market weakness is best exemplified by the NYSE Composite. Where is the rally? Mostly in the momentum indicator which is still overbought! As it corrects, is there any doubt that this index will make new lows?
Sentiment indicators have hardly budged in the past couple of weeks. The short term is currently neutral and the longer term is still slightly bullish.
Summary
The 6-yr and 7-yr cycles are now very close to making their lows. Until they do, we cannot have a sustained uptrend, and signs are already appearing which suggest that the current rally is on borrowed time. This is illustrated by the momentum indicators of all the indices. They are overbought and are beginning to roll over.
The following are examples of unsolicited subscriber comments:
What is most impressive about your service is that you provide constant communication with your subscribers. I would highly recommend your service to traders. D.A.
Andre, you did it again! Like reading the book before watching the movie. B.F.
I would like to thank you so much for all your updates/newsletters. As I am mostly a short-term trader, your work has been so helpful to me as I know exactly when to get in and out of positions. I am so glad I decided to subscribe to Turning Points… Please rest assured that I shall continue to be with Turning Points for a long time to come. Thanks once again! D.P.
But don't take their word for it! Find out for yourself with a FREE 4-week trial. Send an email to ajg@cybertrails.com .
By Andre Gratian
MarketTurningPoints.com
A market advisory service should be evaluated on the basis of its forecasting accuracy and cost. At $25.00 per month, this service is probably the best all-around value. Two areas of analysis that are unmatched anywhere else -- cycles (from 2.5-wk to 18-years and longer) and accurate, coordinated Point & Figure and Fibonacci projections -- are combined with other methodologies to bring you weekly reports and frequent daily updates.
“By the Law of Periodical Repetition, everything which has happened once must happen again, and again, and again -- and not capriciously, but at regular periods, and each thing in its own period, not another’s, and each obeying its own law … The same Nature which delights in periodical repetition in the sky is the Nature which orders the affairs of the earth. Let us not underrate the value of that hint.” -- Mark Twain
You may also want to visit the Market Turning Points website to familiarize yourself with my philosophy and strategy.www.marketurningpoints.com
Disclaimer - The above comments about the financial markets are based purely on what I consider to be sound technical analysis principles uncompromised by fundamental considerations. They represent my own opinion and are not meant to be construed as trading or investment advice, but are offered as an analytical point of view which might be of interest to those who follow stock market cycles and technical analysis.
Andre Gratian Archive |
© 2005-2022 http://www.MarketOracle.co.uk - The Market Oracle is a FREE Daily Financial Markets Analysis & Forecasting online publication.