


Holiday Season Stocks and Commodities Trading
Commodities / Financial Markets Aug 28, 2008 - 06:50 AM GMTBy: Dominick
 The low volumes and relatively low volatility posted over the last several days is proof that many traders are on vacation, or at least biding their time before getting back into the market, whichever side they might choose. And even though I personally took some time off to move my oldest child to college, the closest I've come to a vacation in the last three years, that didn't stop TTC members from getting accurate and timely charts and taking some profits out of the humdrum summer market.
Even non-member readers got advanced warning in last week's update, which said, “the trade against oil and the euro is looking overdone at least in the short term and the equity versus commodities trade next week bears some careful monitoring.” Well, stocks closed at the highs for the week on exactly the sort of reversal we expected. But, whether it was just a relief rally, an oversold bounce, or if this renewed rally in commodities has legs, we'll have to see. TTC members, though, already have access to our Weekly Maps section featuring long term, big picture charts in the relevant markets, and strategy ideas for the week ahead.
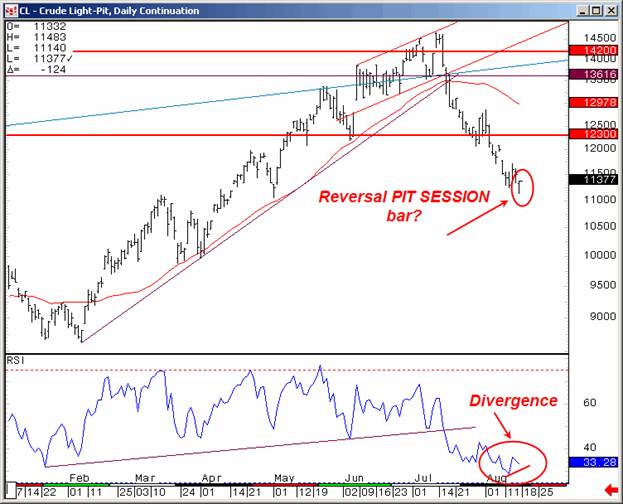
The chart above appeared in the Weekly Maps section last week. The reversal bar on the daily price chart was a big head's up that oil was ready to stretch some resistance to the upside. The divergence in the RSI gave us something to watch for confirmation. As you know, oil rallied strongly over $120 last week. TTC members had existing proprietary targets in gold that helped them take about $10/contract out of the oil market.
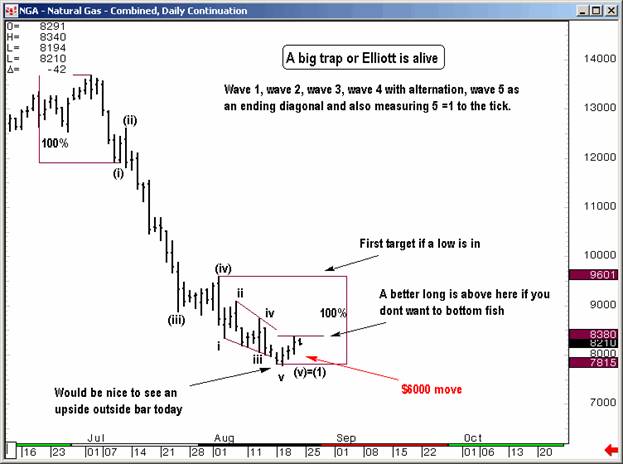
The chart above in natural gas shows a perfect 5-wave down Elliott wave pattern having completed at the end of the previous week. This was yet another suggestion that the move in oil and commodities would be higher last week. When natural gas declined steeply ahead of the Thursday inventory report, the suggestion was put to members to buy calls or go long the futures. This chart, updated to include Friday's action, shows some further support and resistance possibilities from here. TTC traders are more than willing to let the market decide first, after having already captured a $6000 move per option contract off the lows. It remains a mystery how long dead R.N. Elliott knew what the inventory report was going to say. There was a reason that NG stopped exactly where we showed resistance and now members will use the alternate count which is posted in the weekend maps.
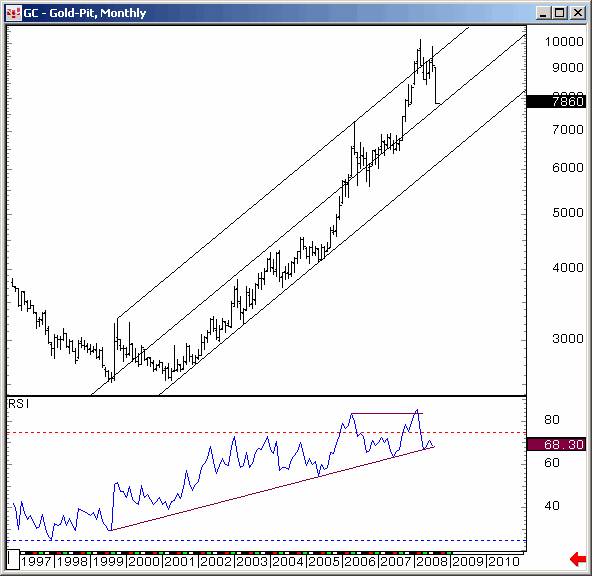
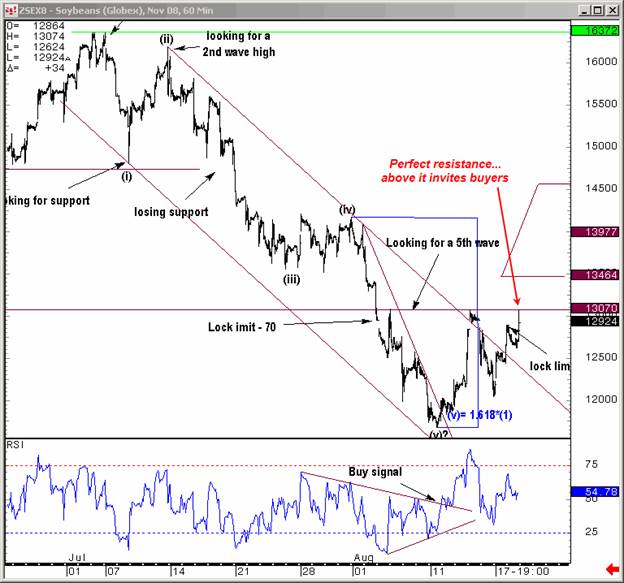
Other commodity markets we've monitored closely over the past few weeks, like gold pictured above, followed suit and played into our reversal expectations nicely. Even soybeans got into the action, trading lock limit up several times off a perfect Elliott wave low before ultimately smacking into perfect resistance.
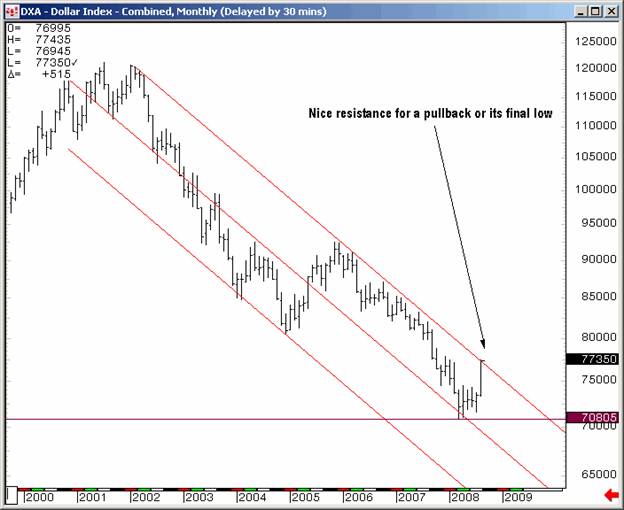
Naturally, a reversal in commodities could reasonably be expected to accompany a similar change in the euro/dollar. Last weekend's Weekly Maps section gave members the Dollar Index chart below, further corroborating our suspicion. But more than a hint at a general change in trend, charts like this one gave members specific areas to watch for key confirmation.
Anytime we have so much corroborating evidence in the charts, we begin to feel very confident about a trend or a trade. Of course, permabears spent the whole week sweating as the crash to new lows they continue to expect continues to elude them. But let's not kid ourselves, the slow August trading could just be a summer phenomenon, but it could also signal that the big money doesn't want to jump back into this market until the S&P is below 1200. If that's the case, we'll be there right alongside them. But when the market clearly wants to go higher in the meantime, we'll trade accordingly. And until there's a break of the current trading range with some serious momentum to prove otherwise, all our moves are assumed to be short term trades only. As for this past week, the key numbers were 1306, 1264, and 1292……looking at a chart makes it seem impossible to have them in advance but members can verify them.
Despite the summer doldrums, TTC has been quite busy since we closed our doors to new retail membership and paused the regular free weekly updates. But coming soon, and for a limited time only, TTC will reopen for new members while space is available. Beginning Saturday August 30 until September 8, or until available spaces are filled, TTC will be accepting new members.
Because we take the quality of our service very seriously, we strictly limit membership and work to develop members' trading skills. Having noticed an improvement in our current membership, most of which are professional, institutional traders, we will accept a limited number of new retail members for one week only. TTC does not issue trade signals because we teach you how to trade. We don't spoon feed you because we teach you how to take care of yourself. So, whether you're a novice trader who wants to get better, or a more experienced pro that's wants to share what they've learned and go to an even higher level in multiple markets and timeframes, TTC is the place for you. Stay tuned for further updates with information on how to join.
Have a profitable and safe week trading, and remember:
"Unbiased Elliott Wave works!"
By Dominick , a.k.a. Spwaver
www.tradingthecharts.com
This update is provided as general information and is not an investment recommendation. TTC accepts no liability whatsoever for any losses resulting from action taken based on the contents of its charts, commentaries, or price data. Securities and commodities markets involve inherent risk and not all positions are suitable for each individual. Check with your licensed financial advisor or broker prior to taking any action.
Dominick Archive |
© 2005-2022 http://www.MarketOracle.co.uk - The Market Oracle is a FREE Daily Financial Markets Analysis & Forecasting online publication.