


The Profoundly Personal Impact Of The National Debt On Our Retirements
Interest-Rates / US Debt Oct 11, 2017 - 01:17 PM GMTBy: Dan_Amerman

 In this analysis we will take a look at something deeply personal – which is how the $20 trillion United States national debt may change the day-to-day quality of life for savers and retirees in the decades ahead. That is likely a somewhat unusual perspective for many savers and investors.
On the one hand, we have what are often thought of as abstract economic concepts - such as how large will the national debt be in 10 or 20 years? How will Federal Reserve actions to increase interest rates change future government deficits and debts?
On the other hand, we have something that is typically presented as being entirely different, which is individual financial planning. What are the savings and investment choices that we need to make today that will help determine what our standard of living may be in retirement 10, 20 or 30 years from now?
The two are often treated as occurring in what could be called two separate universes, with no connection between the nation as a whole and our individual financial situations and choices.
What we will establish in this analysis is that there is a direct and tangible connection between what is happening with the national debt and what our personal future financial situation may be. Indeed, the well-understood measures that a heavily indebted government uses to maintain financial solvency may play a critical role in determining both actual investment outcomes and our future standard of living.
The Impact Of Rising Interest Rates On A Heavily Indebted Nation
This is the third analysis in a series, and while it is not necessary to have read the first two analyses, it could be helpful if some of the concepts explored are not intuitive for you.
In the first analysis linked here, we established the powerful connection between future interest rates and the financial solvency of the federal government.
More specifically, we examined the effects on U.S. government deficits and the national debt if the Federal Reserve were to carry through with raising interest rates by a total of 2.25% from the post-crisis low.
The conclusions were that over the short term of the next 1-3 years, the Federal Reserve does have a great deal of latitude when it comes to raising interest rates. This is because the federal debt has short term, medium term and long term components, and most of the national debt is not initially impacted.
Within 5-11 years, however, maintaining higher interest rates comes at a very high cost as ever more of the national debt rolls over and is reissued at the new interest rates. This would have the effect of doubling the interest payments on the national debt, while drastically increasing the size of the annual deficits.
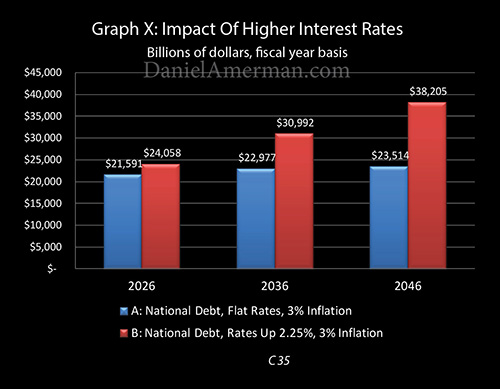
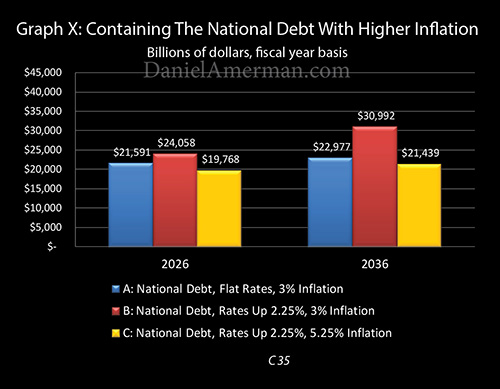
Graph X above shows the future national debt in inflation-adjusted dollars. The blue bars show future debts with no increase in interest rates, and the red bars show the impact of higher interest rates. As explored in the first analysis, when we go to the longer term of 15-20 years and beyond, the Fed's stated plans would create a financial catastrophe scenario, because of the higher exponential compounding rate of 4.5% interest payments versus 2.25% interest payments.
The Inflation Loophole
While the first analysis established the problems with heavily indebted nations increasing interest rates, the second analysis linked here found the loophole: moderately increase the rate of inflation, and any negative effects from moderately increasing interest rates can be overcome.
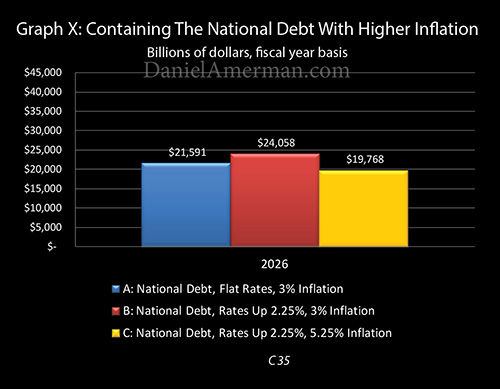
As developed in that analysis, our base Scenario A is the blue bar, and it shows that with no increases in interest rates from the floor, and with historically average inflation, the inflation-adjusted value of the national debt at the end of fiscal year 2026 would be about $21.6 trillion.
If the Fed's total 2.25% increase in interest rates goes through in full and is maintained, then this enough to create the red bar of Scenario B, and an increase in the national debt to about $24 trillion. That is a big problem, and it gets much worse with time.
Unless... inflation is also increased. If that happens, we get the yellow bar of Scenario C, where the harmful impact of what would otherwise happen with an increase in interest rates is completely neutralized, and the inflation-adjusted value of the debt is a "mere" $19.8 trillion.
This could be called a "miracle" solution of sorts. Because the United States is so heavily indebted, the increase in interest rates that savers so badly need would ordinarily have the effect of sending government deficits and debts spiraling upwards, and going potentially out of control. But there is a way out - and this is something that government economists understand very well indeed - and that is to use a higher rate of inflation to negate the damage that would otherwise be caused by higher interest rates.
(In order to tightly focus on the critical but little understood relationship between 1) retirement savings, 2) the national debt, 3) interest rates and 4) inflation, a number of simplifying assumptions were made. The most important is that "net benefits" - the sum of Social Security, Medicare and Medicaid - were left constant as a percentage of the economy at fiscal year 2016 levels. This spending is expected to rise dramatically, which produces much larger deficits over time than those shown.)
The Personal Price Of The "Miracle" Solution
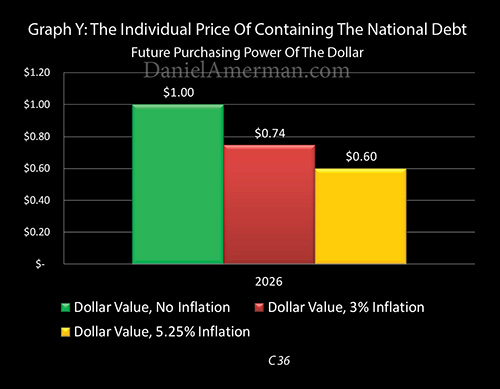
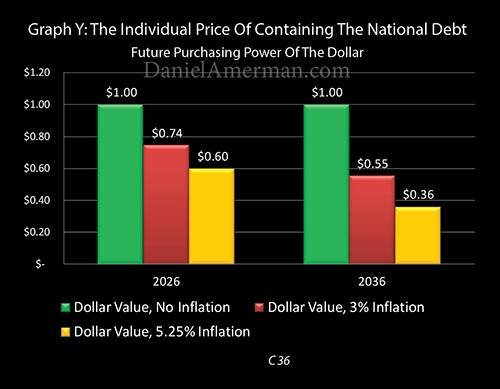
There is however a price that is paid by us all. Graph Y above shows the value of the dollar over time.
If there were no inflation - then we would have the green bar, and the purchasing power of each of our dollars would remain at $1.00.
We have, however, had inflation as a matter of deliberate governmental policy since the United States went off the domestic gold standard in 1933. If we experience roughly historically average inflation of 3% per year, then the dollar becomes worth 74 cents by the end of fiscal year 2026 (the actual average rate of inflation between 1933 and 2017 is 3.54%, we are rounding down to keep this analysis conservative).
The red bar in Graph Y shows the impact of normal historical inflation reducing the value of the dollar to 74 cents. However, that same rate of inflation creates the problem of the red bar of the national debt surging upwards in Graph X.
The nation knocks the red national debt bar down to the more manageable yellow national debt bar in Graph X, by moderately increasing the rate of inflation.
This increase in inflation also simultaneously and necessarily knocks the value of the red bar down to that of the yellow bar in Graph Y. A 5.25% national rate of inflation means that each of our personal dollars has a purchasing power of only 60 cents by 2026.
What is shown above, as the red bar is knocked down to the yellow bar in each graph, is quite direct. The linkage between how a heavily indebted nation deals with moderately higher interest rates - and what each of our dollars will actually buy for us in the future in our personal lives - is absolute.
The Greater Challenge
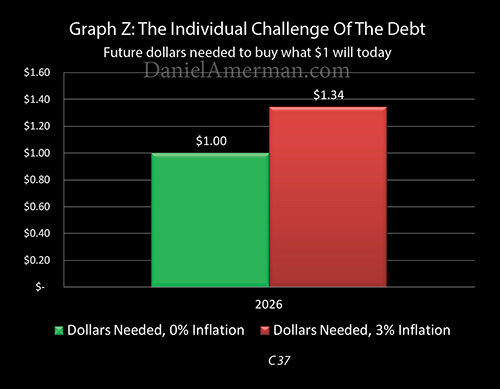
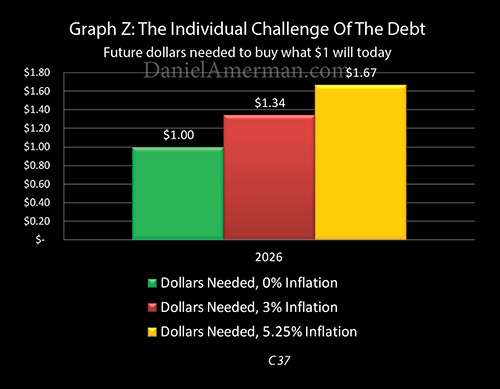
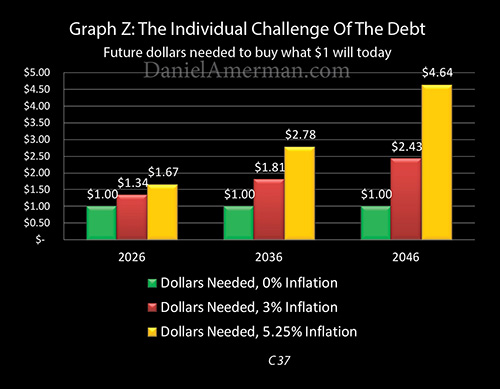
Future purchasing power is a still a little bit abstract for many people, so Graph Z above is intended to make what is happening more tangible and personal.
The green bar is the same as in Graph Y - if there were no inflation, then all we would need is a dollar in the future to buy what a dollar will today.
But - we do have inflation. For 2026, with historically normal 3% inflation, the purchasing power of the dollar falls to 74 cents. So, if we are to maintain our standard of living as planned - we will actually need the red bar of $1.34. The math may seem a little obscure but it is necessary - we need an extra 34% when it comes to the number of our dollars if we are to offset each dollar buying 26% less ($1.344 X 74.4% = $1.00).
If we only have 20% more dollars - then our standard of living needs to drop by about 10% ($1.20/$1.34 = $.90).
Now, when it comes to retirement, most people don't have a big safety margin built into their plans. It is challenging enough just to cover the basics such as shelter, food and health care. So there may not be all that much discretionary income to begin with. And if we are coming up 11% short - there may be little or no discretionary income. Which could mean a night and day difference in what our days are like, and whether we feel reasonably comfortable or that we are instead impoverished and just getting by.
Conversely, if we have a good financial plan, we follow it well, and we end up with $1.50 instead of $1.34 - then we have an extra 12%, all of which could be available for discretionary spending, which could be extraordinarily important for our standard of living and how we feel about our lives.
None of the above is abstract theory - it is instead our historical reality. The specifics have varied by the year and decade, but on average (and rounded down), about 3% of the value of the dollar has been lost each year since 1933, and that means that every ten years, we have to have replaced each $1.00 of savings with $1.34 - or we lose standard of living and financial security.
The Personal Impact Of The National Debt
As shown in a different version of Graph Z below, the personal impact of the national debt is that it doubles our challenge.
When we knocked the red bar of the national debt down to the yellow bar (Graph X), and knocked the red bar of the purchasing power of the dollar down to the yellow bar (Graph Y) - we necessarily and directly effectively doubled the additional dollars we will need to earn, in order to maintain the same standard of living in retirement, even in just ten years.
If the purchasing power of the dollar falls to 60 cents, then we need not $1.34 - but $1.67 ($1.67 X 60% = $1.00).
So instead of needing an additional 34 cents for each dollar of savings we have now (the red bar) - we will need an additional 67 cents (the yellow bar). The hurdle is twice as high for keeping what we have.
And we have to do this on an after-tax basis, after paying higher taxes on the necessary higher income to offset the higher inflation, or again, we lose standard of living.
There are moderately higher interest rates to work with, and some investment categories do generally keep up with inflation. Those can each be an additional source of dollars, helping to get us from 34 cents up to 67 cents.
But higher interest rates and inflation have other effects as well. It goes beyond the scope of this analysis, but all else being equal, higher interest rates can lead to lower stock prices in several different ways. Higher mortgage rates can mean lower real estate and REIT prices. Higher interest rates and higher rates of inflation in combination have a double impact on reducing the prices and real values of interest-based assets such as bonds, and the value of future cash flows from such assets as fixed rate annuities or fixed pensions.
So, the whole mix changes (as should the financial planning process).
It is certainly possible to do this, but there is no getting around that it is just plain harder to meet the greater challenge. We need to try different approaches, and increase the focus on overcoming inflation on an after-tax basis.
For those among us who don't succeed or only partially succeed in meeting the greater challenge - then the math gets crueler.
That same $1.34 that would have kept our spending power even - is now 20% short ($1.34/$1.67 = 80%). That is perhaps all of our discretionary spending and the rest needs to somehow come out of our basics of shelter, food and medical care as well. Or the savings go faster, and the time comes forward when it could be just Social Security and Medicare that pays for everything (or doesn't).
If all we end up with is $1.20 in the future for each dollar today, then instead of being 10% short - we will be end up being 28% short of being able to pay for our desired standard of living ($1.20/$1.67= 72%).
If, after taxes we end up with $1.50 in the future for each dollar today - which was our successful financial planning outcome with 3% inflation - then instead of having a more comfortable retirement, we are coming up 10% short ($1.50/$1.67 = 90%).If we do not meet the greater challenge of higher inflation, this could mean that most or all of our discretionary spending is lost .
Using the red and yellow bars, what is uniquely shown in this analysis is an example of how the direct correlation can work between the national debt and each of our individual financial outcomes. What may seem abstract is instead the deeply personal, and can change every aspect of daily life for many millions of people.
The 20 Year Challenge
Because the power of higher interest rates and the compounding of those rates each increase with time, our challenge is much greater in 2036 than it is in 2026.
As shown in Graph X the red bar of the national debt would be up to almost $31 trillion if rates go up to the extent the Federal Reserve would like - and if the rate of inflation doesn't change.
That said – the same "miracle solution" (which is a basic part of macroeconomics) still applies. Increase inflation by 2.25% at the same time that interest rates go up by 2.25%, and that red bar is knocked right back down to the yellow bar of about $21.4 trillion dollars. The damage from the increase in interest rates is entirely neutralized.
There is a steep price for this, however, as we can see in Graph Y.
With a historically average rate of inflation of 3%, if we go out to 2036, then the red bar of the purchasing power of the dollar would ordinarily be down to 55 cents.
But as a direct result of the same process that knocked the $31 trillion dollar red bar in Graph X down to the yellow bar of a $21.4 trillion real debt for the nation - on an individual basis, what our dollars are likely to buy for us goes from 55 cents in the red bar in Graph Y, down to 36 cents in the yellow bar.
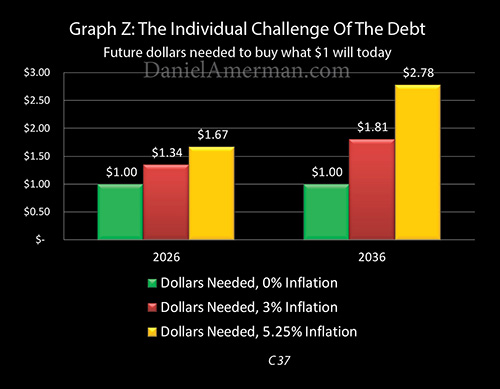
Which means that - as shown in Graph Z - the hurdle is raised much more dramatically when we go 20 years out, instead of 10 years out.
A moderate inflationary increase from 3% to 5.25% means that by 2036 instead of the red bar of needing an extra 81 cents for every dollar we have today – in order to maintain purchasing power – we need an extra $1.78. We need the much higher yellow bar, and a total of $2.78 to buy what one dollar will today.
Again, there is the direct correlation between the national and the deeply personal:
X) The red bar of the inflation-adjusted national debt is knocked down from $31 trillion to the yellow bar of $21.4 trillion;
Y) the moderate increase in inflation that accomplishes this also necessarily knocks the future purchasing power of our savings down from the red to the yellow, and the purchasing power of the dollar drops from 55 cents to 36 cents; and
Z) this necessarily raises the challenge for investors as the red bar of 81 additional cents being needed to maintain standard of living, jumps up to the yellow bar of an additional $1.78 being needed. Or we lose standard of living.
The hurdle of getting enough dollars to overcome inflation is much higher in 20 years than in 10 years - and so is the cost of not quite succeeding.
With our ten year example, if by the time all was said and done we were able to come up with the $1.34 to offset historical inflation - but inflation were moderately higher because that is the traditional cure for higher national debts - then we ended up being 20% short when it came to paying for our lifestyle.
When we go twenty years out, if we successfully overcome the hurdle of 3% inflation, then we do have $1.81 for each dollar today. However, if inflation was actually 5.25% instead, then what we needed was $2.78, and our shortfall is no longer 20% - but 35% ($1.81/$2.78 = 65%).
Now, a 20% reduction in the monthly purchasing power of savings would be major for most retirees. But if most money is going for necessities, there is not all that much for discretionary spending, and the shortfall turns out to be 35% instead - that is life changing. That is an outcome that is an order of magnitude worse, with potentially major effects on day to day lifestyle and financial security.
This is not to say that the challenge is at all impossible. Twenty years is a long time to work with on the investment side, and there are certainly ways to meet the challenge.
The point being made in this simplified analysis is that there is a direct linkage between the national and the personal, and it exists whether most retirees and retirement savers are aware of it or not.
Heavily indebted governments face limitations with regard to interest rates and inflation which less indebted governments do not. These limitations help create the long term investment environment, and thereby will influence - and possibly drastically change - each of our lifestyles and financial security in retirement.
So, all else being equal, the bigger the national debt relative to the economy, then the greater the challenges facing individual savers and investors, and the greater the personal penalty if our individual financial plans are not up to the higher challenge.
Another hurdle to overcome is the taxes on the income needed to stay ahead of inflation. With our ten year example, we had to come out with $1.67, after paying the taxes on the income we earned to get there. With the ten year example, we have to pay taxes on quite a bit more income, in order to have $2.78 remaining after tax.
Making this more difficult is that as explored in the analysis linked here, the higher the rate of inflation, the higher the effective tax rate. This is not something that most investors are taking into account, but it is of critical importance.
So it is not just that on a personal basis in order to maintain our standard of living we now need to be coming up with an extra $1.78 for each dollar we have now, but we have to be able to do this after paying an effectively higher tax rate on the investments than what we would have been paying with a lower inflation rate.
The Longer Term
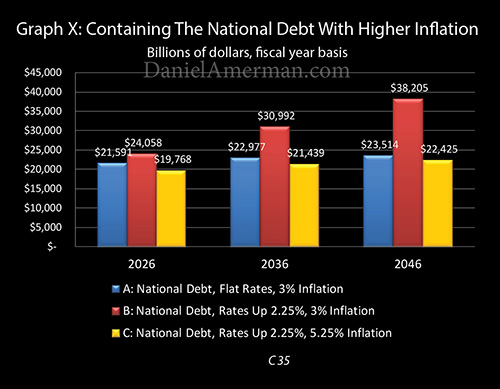
The farther out in time we go, the more difficult the situation becomes. As we can see in Graph X above by the year 2046 if there were no increase in interest rates, and we experienced a historically average rate of inflation, the national debt on an inflation-adjusted basis would be about $23.5 trillion, as shown by the blue bar.
If we increase interest rates by a relatively moderate amount, just 2.25% from the post-crisis lows which is what the Federal Reserve has been discussing, and we don't increase inflation beyond a historic average of three percent, then we end up with a inflation-adjusted national debt that is almost twice as high. The red bar reaches $38 trillion and this could be financially crippling for the nation.
We do however have a "miracle" solution. And that is if we just modestly increase the rate of inflation, then we get the yellow bar and the inflation-adjusted value of the national debt falls to just $22.4 trillion.
There is, however, a price, as shown in Graph Y below.
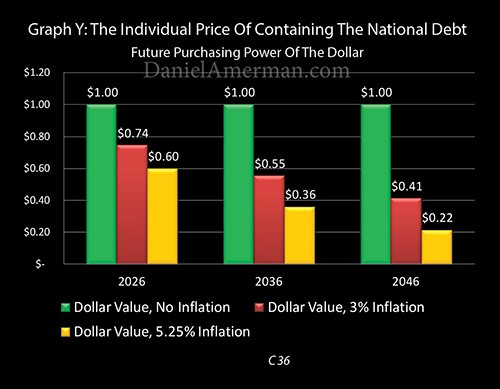
If the dollar were to remain a dollar then we have the green bar. The value of the dollar by 2046 with historically average 3% inflation is the red bar, meaning it will buy what 41 cents will today.
With our "miracle" solution of moderately increasing the rate of inflation, we get the yellow bar and a dollar becomes worth only 22 cents by 2046.
The true cost of containing the national debt with just a moderate increase in inflation can be seen when we look at the green, red and yellow bars for 2046 in graph Z below.
If there were no inflation at all, then we have the green bar where all we need to do is have a dollar in the future to purchase what a dollar will buy today.
With even a historically normal, average rate of inflation of about 3%, then we would need an additional $1.43 cents for every dollar we have today, to maintain our purchasing power.
However, if a heavily indebted nation – which the United States is – even moderately raises the rate of inflation in order to help contain the national debt, which again has happened with many nations over the centuries, then all of us have to come up with an additional $3.64 for each dollar we have today, in order to keep our spending power.
Once again, there is the direct correlation between the national and the deeply personal:
X) The red bar of the inflation-adjusted national debt is knocked down from $38 trillion to the yellow bar of $22.4 trillion;
Y) the moderate increase in inflation that accomplishes that also necessarily knocks the future purchasing power of our savings down from red to yellow, and the purchasing power of the dollar drops from 41 cents to 22 cents; and
Z) this necessarily raises the challenge for investors as the red bar of an additional $1.43 being needed to maintain standard of living, jumps up to the yellow bar of an additional $3.64 being needed. Or we lose standard of living.
The hurdle of getting enough dollars to overcome inflation is far higher when we go 30 years out, indeed it now dwarfs the yellow bars of 10 and 20 years out.
As referenced in the prior section, this needs to be achieved after paying a higher effective tax rate on the much higher income that is needed.
And if our financial strategy is good enough to overcome a historically average rate of inflation on an after-tax basis - but can't quite handle the moderately higher rate of inflation that keeps a heavily indebted nation financially solvent - then the penalty for not quite meeting the challenge becomes much more severe.
If we only keep up with a 3% rate of inflation - but not a 5.25% rate of inflation - then by 30 years out we are coming up short by 48% when it comes to the ability to pay for our standard of living ($2.43/$4.64 = 52%). This is much greater than the 20% shortfall when we look 10 years out, and the 35% shortfall that we find 20 years out. With correspondingly greater consequences for quality of life and financial security.
The farther out in time we go, the greater the challenges that are created for us on an individual basis as a result of the current $20 trillion total United States national debt.
Impact On A Successful Investment Strategy
And again, this same math not only still applies to "successful" investors, but it also gets more powerful with time. Let's say someone averages a 7% return per year, which is a good outcome, particularly on an after-tax basis.
They would have about $7.61 thirty years from now for every $1.00 they have today. With a 3% historically average rate of inflation, that would be a purchasing power of about $3.14 compared to the dollar today.
With a moderately higher 5.25% rate of inflation, the purchasing power drops to $1.64. Which is a reduction of standard of living in retirement of about 48%.
So, the long term investment strategy is quite successful. The increase in the rate of inflation is moderate. In this example, there never is an outright crisis or meltdown, there never is hyperinflation or high rates of inflation - or a default on the national debt. But yet, by the time all is said and done - the standard of living in retirement is down by almost 50% over the long term.
Meaning the national debt would indeed completely transform both the actual results of the financial planning process and the day to day quality of life for many millions of people.
But yet, the process would occur subtly and in the background. There would never need to be a high drama incident, a place where the headlines would scream that it was the national debt that was destroying investment results and lifestyles, and everyone would suddenly realize what was happening. Even though the slowly building destruction of wealth and lifestyle would indeed become ever more dramatic over time.
Could something like that happen?
Choosing A Holistic Perspective
In broad terms, one could say there are two different perspectives on the relationship between the national debt and financial planning for retirement.
The first and most common perspective is to completely ignore the existence of the national debt and to make decisions that are effectively based upon the past repeating itself. Even though we know the circumstances have changed.
Now this may not be explicitly phrased that way, we may not say that we're choosing to ignore the national debt, but that is nonetheless the bottom line.
There is an alternative perspective which is to fully incorporate the national debt into the decisions we make. In other words choose a holistic perspective that takes into account our overall situation as a nation as well as what we're trying to accomplish as individual savers.
Large national debts have multiple influences when it comes to the factors that determine the success of financial planning strategies as well as our standard of living in retirement. What this analysis focused on was inflation – and there is indeed a critical relationship between the national debt and individual outcomes.
Something else that is critically important and that has been transformed in recent years has been interest rates.
Interest income is for many people one of the core components of building wealth for retirement as well as determining standard of living in retirement.
However in the immediate aftermath of the financial crisis interest rates plunged to record lows. And while many people are hoping that interest rates will rise substantially, as we have established in this series of three analyses there is a powerful relationship between interest rates and the national debt. If interest rates get too high then the national debt shoots upwards – unless inflation is increased.
This is not theory, but as explored in the analysis linked here, what we've been experiencing in practice in recent years, which is a 90% to 95% reduction in long term wealth creation as a result of the very low interest rate levels that we currently have. And the extension of these issues with wealth creation may be likely because of the high level of the $20 trillion current national debt.
There was another key factor which we left out in this analysis which is the coming major increases in total Social Security and Medicare payments that will need to be made by the government as the Boomers continue to retire. The dollar amounts of these expected payments are stunning, but we had to set them aside in this simplified analysis in order to focus in on the key relationships between the 1) national debt, 2) retirement income, 3) inflation and 4) interest rates.
As is developed in the analysis linked here there are two critical components that most people are not taking into account when it comes to Social Security decisions, and related financial planning decisions.
The first is a key bit of information that perhaps many non-economists are not aware of – and that is that there is no certainty about future Social Security payments. There is instead a race that is happening between economic growth and benefits.
As is also explored in the linked analysis, there is something that we know however – which is that when the national debt rapidly doubled, the terms of the race changed.
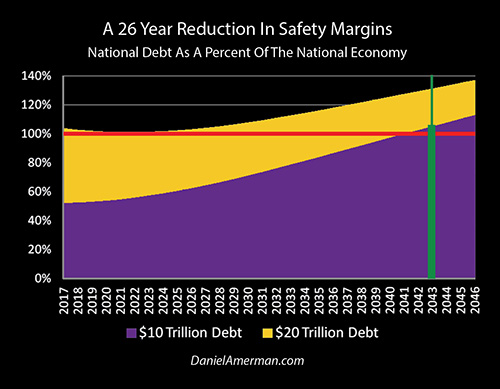
We used to have a 26 year safety margin, where payments in full could have been made on Social Security and Medicare until the year 2043, and the nation would've been in continuously better financial health that entire time than it is right now. It is the doubling of the national debt that gave this lead away and fundamentally changed the future financial health of Social Security and Medicare.
The National Debt And Three Foundations Of Retirement Financial Planning
Let me suggest there are three major foundations when it comes to retirement financial planning for any given month or year in the future.
1) What is the dollar amount of our spendable savings?
2) What is the purchasing power of those savings?
3) What is the purchasing power of our government benefits?
The quick doubling of the national debt impacted all three of these core foundations. And it does not get any more personal than that, because it is those three together that determine day-to-day quality of life as well as financial security.
The increase in the national debt has not necessarily created a doom and gloom scenario, this does not need to be about pessimism. All of these factors can be overcome.
But what they do is that in combination they create a greater challenge than most people are taking into account. And what that means is that better strategies and better decisions are needed to overcome those challenges.
The starting point for this process is to look the challenges straight in the eye, see them with clarity, and make sure that we have reality-based plans for overcoming them. Hopefully this series of analyses has aided you in better understanding those challenges.
Daniel R. Amerman, CFA
Website: http://danielamerman.com/
E-mail: mail@the-great-retirement-experiment.com
Daniel R. Amerman, Chartered Financial Analyst with MBA and BSBA degrees in finance, is a former investment banker who developed sophisticated new financial products for institutional investors (in the 1980s), and was the author of McGraw-Hill's lead reference book on mortgage derivatives in the mid-1990s. An outspoken critic of the conventional wisdom about long-term investing and retirement planning, Mr. Amerman has spent more than a decade creating a radically different set of individual investor solutions designed to prosper in an environment of economic turmoil, broken government promises, repressive government taxation and collapsing conventional retirement portfolios
© 2017 Copyright Dan Amerman - All Rights Reserved
Disclaimer: This article contains the ideas and opinions of the author. It is a conceptual exploration of financial and general economic principles. As with any financial discussion of the future, there cannot be any absolute certainty. What this article does not contain is specific investment, legal, tax or any other form of professional advice. If specific advice is needed, it should be sought from an appropriate professional. Any liability, responsibility or warranty for the results of the application of principles contained in the article, website, readings, videos, DVDs, books and related materials, either directly or indirectly, are expressly disclaimed by the author.
© 2005-2022 http://www.MarketOracle.co.uk - The Market Oracle is a FREE Daily Financial Markets Analysis & Forecasting online publication.