


Weekly Gold and Silver Technical Analysis Report - 25th March 2007 - Technically Precious with Merv
Commodities / Gold & Silver Mar 25, 2007 - 06:01 PM GMTBy: Merv_Burak

Friday's sharp reversal almost wiped out the gains from the previous 4 days. Is this a new reversal or just nervous nellies selling prior to a week-end?
Relative Strength (RS)
I don't remember how I got started on this but I guess I'd better finish it off. In my tables of technical information and ratings (an example is usually published at the end of my commentaries) is a column called RS for Relative Strength. As I have explained briefly in previous commentaries what the moving average (MA) and momentum (MOM) columns of information are all about I guess I should finish and explain the last of the information columns. There is still the RATINGS (RATE) column but I'll leave that for possibly next week.
As the name implies, RS compares the strength of one item relative to another item. Now there are many different strengths that can be compared and many standards to compare against. As with my comments about momentum, one really must understand what one is comparing, and how, to really understand any particular Relative Strength value. In a nut shell, the performance of each stock or Index in a table is compared to the performance of a benchmark, relative to a specific time period. The stock or Index that had the best comparative performance is given the number one rating. The stock or Index that came out second best is given the number two, and so forth. From this you know which stock or Index performed the best for whatever investment time period you are interested in (short, intermediate or long term). A second piece of information in the table are the + or – symbols. What these indicate is whether the performance of the stock or Index is improving relative to the performance of the benchmark or getting weaker relative to the performance of the benchmark.
I find the + and – information the most useful of the two pieces of information under this column. The performance number is just an indication of historical performance to date. A stock can have the best performance over the past intermediate term but could drop over a cliff tomorrow. The + and – indicates if the past week's performance is still getting better or not. You might want to be in a stock that has continued improvement in its performance and be on guard when the performance goes -. Again, the performance that is being measured is versus the performance of the benchmark. Both the stock and the benchmark may be moving higher. What is measured is if the performance of the stock had been greater than or weaker than the performance of the benchmark. If the benchmark advanced 2% on the week and the stock advanced only 1%, but still advanced, this would show up as a – in the table to indicate weaker performance versus the benchmark. We could have both declining on the week but still have a + for the stock if its decline was not as much as the benchmark decline. The name tells it all, RELATIVE.
As for the benchmark, for each table I calculate a separate Index based upon the average performance of all table component stocks or Indices. So, in effect, the benchmark used is the average performance of all stocks or Indices of the table. The relative performance of a particular stock or Index is therefore relative to the average of the component stocks or Indices, not some outside or unconnected benchmark.
Is this useful information? Well let's just take an example. In the Gold Indices Table at the end of these commentaries there are a set of Merv's Gold Indices. There are three separate gold sector Indices representing quality, speculative and gambling type of gold stocks. If you were holding some speculative gold stocks but you see that the RS for the speculative Index is – while the RS for the quality is +, you might want to consider moving from the speculative to the quality where the Index is improving rather than weakening versus the benchmark performance.
GOLD : LONG TERM
There is still insufficient new action that would make a long term chart necessary to understand the long term analysis. The intermediate term chart (with a long term moving average) should be sufficient for now.
Friday's action in the April contract was a little scary but it didn't change anything from the long term perspective. Gold is still trading above a positive long term moving average line and momentum is still in its positive zone. Although positive the momentum activity continues to under perform showing a very weak price activity. Is this a precursor to a serious decline? I don't know, but it is something to keep in mind until more strength enters the picture.
For now I remain NEUTRAL on the long term prognosis although everything is in the positive side for now.
INTERMEDIATE TERM
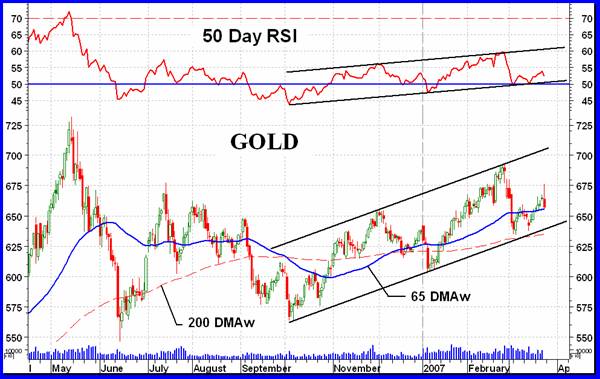
Technically, the intermediate term P&F chart went bearish during the plunge in early March and remains so. It is, however, in a strong rebound and has crossed back above its previous up trend line, back into the up trending channel shown here a few weeks ago. The bear signal may turn out to be a false signal, or it just could turn out to be an early bear signal with future action on the down side. I'm not sure which it will be so am going with the P&F signal as it is.
The normal indicators are still on the opposite side of the trend to the P&F as everything is still positive. The price action is still above a slightly positive moving average line and the momentum indicator is still in its positive zone. In addition, the up trending channel on the bar or candlestick chart has not been violated on the down side and the price remains inside the channel. Momentum the same. Although positive, neither of these indicators are anywhere near comfortably positive. The momentum especially is showing real weakness by continuing to move just above its neutral line, ready to drop below. Any continuation of Friday's price action would see momentum drop below its neutral line and below its channel support line.
Last week I went – NEUTRAL as far as the rating was concerned. I'll remain so for another week.
SHORT TERM
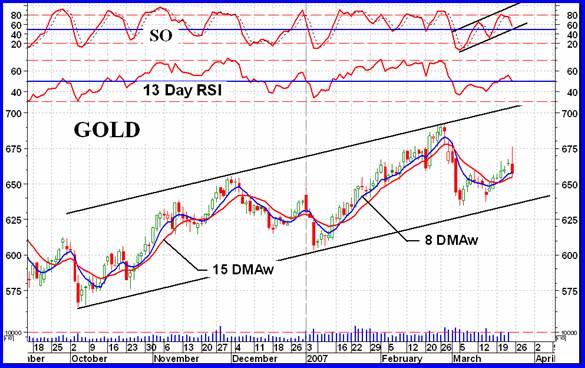
The short term was starting to look okay with the price moving above its short term moving average line and momentum moving higher and finally crossing into the positive zone. However, weakness in the price action was indicated on Wednesday and Thursday (see next section) with a turn around in the price on Friday. As yet the action has not signaled a reversal of the short term trend as both the price and momentum are still positive but only very slightly so. One more down day and everything will go negative on the short term. The Friday's action suggests that we will most likely have a negative day on Monday.
IMMEDIATE TERM
Although we seemed to have a nice little rally going during the week the actions of the Stochastic Oscillator gave us a warning on Wednesday and Thursday that all may not be that great. On Friday the turn came. A careful look at the SO shows us a move into the overbought zone on Tuesday followed by lower values and a cross below the overbought line on Wednesday and Thursday. A non-confirmation message from the aggressive momentum indicator. Although the Friday price closed just below the very short term moving average line the line itself was still pointing upward. However, everything seems to point to a negative start of the week for gold. As always, events in the Middle East are very volatile and things could change for the better, especially for the British, at any moment so the immediate term is nothing other than a toss of the coin.
NORTH AMERICAN GOLD INDICES
Well, we are back to the S&P/TSX Global Gold Index.
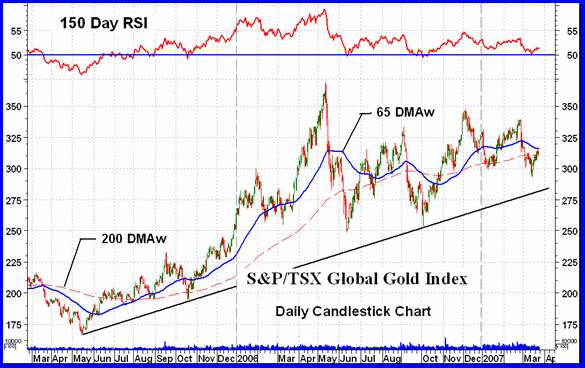
The looks of the Index action over the past year is somewhat different from that the PHLX Gold & Silver Sector Index shown last week. The S&P/TSX Global Gold Index is more lateral with maybe a very slight upward bias while the PHLX was most definitely a weaker Index trapped inside a downward sloping channel. The people at S&P who are responsible for developing this Index probably wanted to make this Index more representative of the “global” gold situation but all I can see happened is the inclusion of some U.S. traded stocks (a few mighty large ones) to the list. What may be the result over time is an Index that will be very similar to the PHLX Index, if not almost identical. But we'll just have to wait and see. Competitive wise maybe that's the idea as the PHLX may have more of the profitable derivative products that S&P may want to have on their Indices.
Despite the somewhat different drift to the two Indices they are moving very similarly as far as recent action is concerned. Nothing exciting but weak. The S&P/TSX Index tried to make a move late last year but that ended quickly. In general the indicators are still slightly positive on the long term and slightly negative on the intermediate term. One might say that as long as this Index stays above that up trend line everything is still okay.
MERV'S PRECIOUS METALS INDICES
All of the Indices, metals and the US $ were up on the week. Usually one would see at least something going in the opposite direction, usually that would be the US $. Although everything rose there did not seem to be much strength behind the moves so caution is advised. Although all of the Merv's Indices in the table had made new all time highs recently the Composite Index of Precious Metals Indices has not yet done so. It has been held back by the performances of the other North American Indices which have not yet reached new all time highs.
MERV'S GOLD & SILVER 160 INDEX
The overall universe of 160 stocks advanced 2.9% on the week. Not great but respectable. With this past week's action the Index is once more above its positive intermediate and long term moving average lines. The momentum indicators are also in their positive zones but still showing weakness versus Index action.
On the breadth indicator side, we had twice as many component stocks advancing as declining (64% advancing and 32% declining). On the summation of individual stock ratings, things improved somewhat but still didn't change the ratings status. The short term is NEUTRAL with neither a bull nor a bear in control. The Intermediate term is also NEUTRAL while the long term remains BULLISH with 62%.
In looking over the universe of 160 stocks I find that those stocks whose last primary intermediate term rating was POS are still in the minority at 47% while those whose last primary rating was NEG were in the majority at 53%. The drift this past week was significantly towards the POS so maybe another week and there will be more stocks in the POS category than in the NEG for a good sign as to which way the drift is moving, but let's wait till next week before celebrating.
As for greedy speculation, there were three stocks that made it into my plus/minus over 30% weekly gain category, on the plus side. This shows speculation starting to rear its head but not yet at the real greedy level.
MERV'S QUAL-GOLD INDEX MERV'S SPEC-GOLD INDEX MERV'S GAMB-GOLD INDEX
Two of the sector Indices put in good performances above the 3% level while one was only a little above 1%. The Gamb-Gold Index had the best performance during the week with a gain of 3.8%. The Gamb-Gold Index has been the top performing Index, in all time periods, of all the Indices in the Gold Indices Table for four weeks straight now. Best part is that its performance is still + relative to the Composite Index of Precious Metals Indices, which is the benchmark Index for that table. The Qual-Gold Index is one of the poorer performing of the Merv's Indices and is straddling the middle ground in the ratings.
What we have this week are Indices that are all now above positive intermediate and long term moving average lines. In addition, all momentum indicators are positive e. Although the table ratings for the Qual and Spec-Gold Indices are + N the momentum indicator used in the tables is not as quick to turn as the RSI used for commentaries. I'll go with the table ratings anyway.
As for the summation of individual ratings, they are long term BULLISH for all three Indices and NEUTRAL for the intermediate and short term, except for a BULL intermediate term for the Gamb-Gold Index.
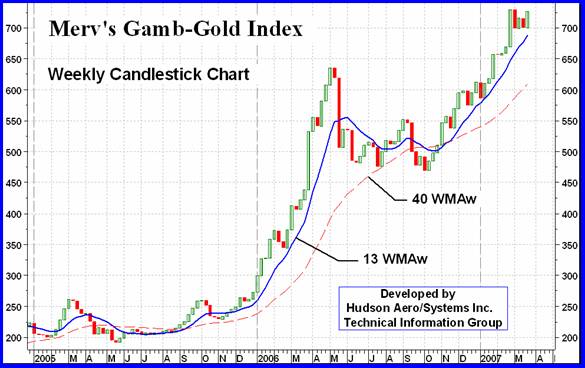
Check out the “quality” performance (S&P/TSX Global Index) versus gambling performance (above).
SILVER
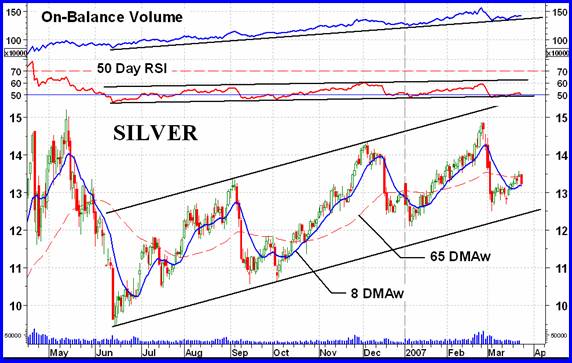
Silver continues to just hold its own for now. Although the price is still well entrenched inside an up trending channel the momentum and volume indicators look like they are on their last legs. Still above their support trend lines, both look like they are ready to break down any moment. It's quite obvious that should we have another day or two of negative silver prices these indicators will go negative in advance of the price dropping below its support line. At the present time the odds favor lower prices but who knows, maybe the price support line will do the job.
MERV'S QUAL-SILVER INDEX
Over the past year this Index of 10 stocks had been one of the better performers but is now just so-so. As with all of the Merv's Indices the momentum indicator continues to under perform versus the Index performance. How much longer this will go on remains to be seen but something's gotta give.
MERV'S SPEC-SILVER INDEX
The Spec-Silver Index had been giving the Gamb-Gold Index a run for its money in performance, always just on the heels of the Gamb-Gold Index. It seems that the distance between the two is starting to widen. While the Gamb-Gold retains its number one spot in all time periods the Spec-Silver is now at number 12 and losing steam on the short term. Although still number two in the intermediate term it is losing steam here also with a – in the RS column. It is also the only Merv's Index that closed on Friday barely above its intermediate term moving average line and the line still pointing down. Will silver catch on fire again? We'll just have to wait and see.
MERV'S PRECIOUS METALS INDICES TABLE
Merv Burak,
CMTHudson Aero/Systems Inc.
Technical Information Group
for Merv's Precious Metals Central
Web: www.themarkettraders.com
e-mail: merv@themarkettraders.com
During the day Merv practices his engineering profession as a Consulting Aerospace Engineer. Once the sun goes down and night descends upon the earth Merv dons his other hat as a Chartered Market Technician ( CMT ) and tries to decipher what's going on in the securities markets. As an underground surveyor in the gold mines of Canada 's Northwest Territories in his youth, Merv has a soft spot for the gold industry and has developed several Gold Indices reflecting different aspects of the industry. As a basically lazy individual Merv's driving focus is to KEEP IT SIMPLE .
To find out more about Merv's various Gold Indices and component stocks, please visit www.themarkettraders.com and click on Merv's Precious Metals Central . There you will find samples of the Indices and their component stocks plus other publications of interest to gold investors. While at the themarkettraders.com web site please take the time to check out the new Energy Central site for the most comprehensive survey of energy stocks on the internet.Before you invest, Always check your market timing with a Qualified Professional Market Technician
© 2005-2022 http://www.MarketOracle.co.uk - The Market Oracle is a FREE Daily Financial Markets Analysis & Forecasting online publication.