


Why Bitcoin can pullback from $6100 – $6800?
Currencies / Bitcoin Oct 23, 2017 - 06:22 PM GMT

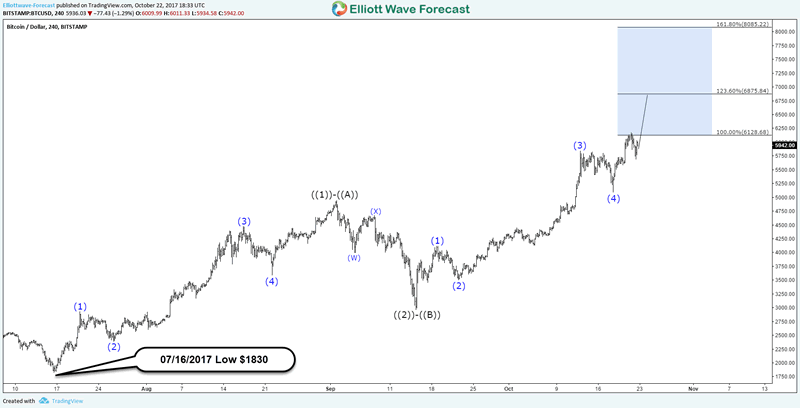
 Bitcoin continue it’s outstanding performance as it managed to breach the $6000 barrier this weekend, it currently up 200% from 07/16 low and with a total of 500% for this year. The rally from $1830 low is represented by 3 swings subdivided into 5 waves rally then 3 waves pullback followed by another 5 waves.
This type of move can be either labeled as 3 waves Zigzag Structure which can end around equal legs area $6100 – $6800 or it can be part of a 5 waves move which means BTCUSD still needs to extend further toward $8000 as the most powerful 3rd wave move usually reach the 1.618 Fibonacci extension level.
To be able to identify which scenario will take place, we’ll wait for the next pullback to take place then depending on the structure and strength of move we’ll know if it’s only correcting the cycle from 09/15 low or the full cycle from July low has ended.
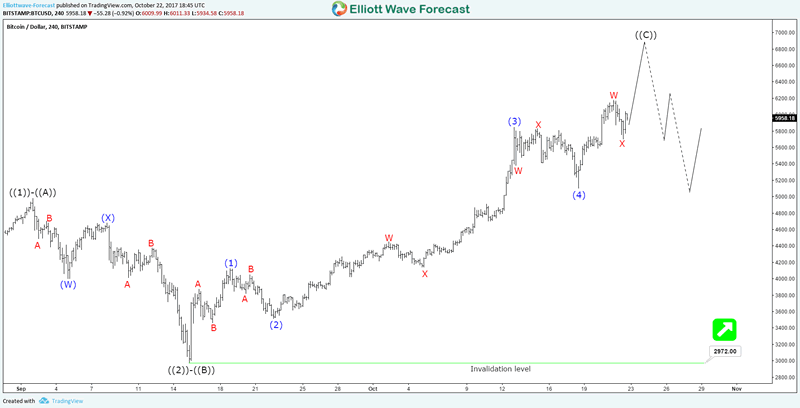
BTCUSD Cycle from 07/16/2017 Low
Currently the cycle from $2972 is still in progress as 5 waves ending diagonal, which already have enough number of swings to call it completed. However, the target for wave 5 can be calculated in 3 different ways and in that case the digital currency can still see more upside in the short term as we have these targets :
- Wave (1) = Wave (5) = $6255
- 123.6% – 161.8% invested extension of wave (4) = Wave (5) = $6022 – $6300
- 61.8% extension of wave (1) + wave (3) = Wave (5) = $6880
BTCUSD Wave ((C))
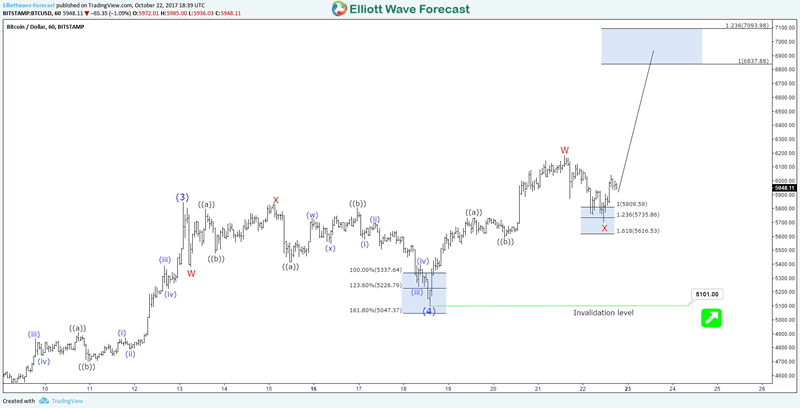
We can also use the internal structure in the 1H chart to calculate the move higher, which is expected to take place as 7 swings double three structure looking to reach equal legs area $6837 – $7093 as long as it remain above $5101 low.
BTCUSD 1H Chart 10.22.2017
Consequently, Bitcoin shorter term cycles are still calling for more upside but the bulls needs to be careful about chasing the logn side here as the cycle is mature and can turn anytime soon after hitting the mentioned targets above.
Bitcoin Recap
The digital currency is entering an important extreme area around $6100 – $6800 which can produce at least 3 waves pullback before it can either resume the rally to reach $8000 or start a larger correction that can take it back lower toward $4000.
More insights about Bitcoin can be seen through our Free Cryptocurrencies page including other updates for Ethereum, Ripple and Litecoin. We are also covering it during our live session in Group 3 which you can gain access using our 14 days Trial.
By Ayoub Ben Rejeb
https://elliottwave-forecast.com
ElliottWave-Forecast has built its reputation on accurate technical analysis and a winning attitude. By successfully incorporating the Elliott Wave Theory with Market Correlation, Cycles, Proprietary Pivot System, we provide precise forecasts with up-to-date analysis for 52 instruments including Forex majors & crosses, Commodities and a number of Equity Indices from around the World. Our clients also have immediate access to our proprietary Actionable Trade Setups, Market Overview, 1 Hour, 4 Hour, Daily & Weekly Wave Counts. Weekend Webinar, Live Screen Sharing Sessions, Daily Technical Videos, Elliott Wave Setup .
Copyright © 2017 ElliottWave-Forecast - All Rights Reserved Disclaimer: The above is a matter of opinion provided for general information purposes only and is not intended as investment advice. Information and analysis above are derived from sources and utilising methods believed to be reliable, but we cannot accept responsibility for any losses you may incur as a result of this analysis. Individuals should consult with their personal financial advisors.
© 2005-2022 http://www.MarketOracle.co.uk - The Market Oracle is a FREE Daily Financial Markets Analysis & Forecasting online publication.