


Stock Market Positive Expectations, But Will S&P 500 Continue Higher?
Stock-Markets / Stock Market 2017 Dec 04, 2017 - 05:14 PM GMTBy: Paul_Rejczak

 Briefly:
Intraday trade: Our Friday's intraday trading outlook was bearish. It proved accurate because the S&P 500 reached our intraday profit target level of 2,615 (daily low at 2,605.52). the index fell sharply following relatively neutral opening of the trading session. The market has managed to close neutral (-0.2%). We still can see some short-term technical overbought conditions. However, there have been no confirmed negative signals so far. Therefore, we prefer to be out of the market today, avoiding low risk/reward ratio trades.
Our intraday outlook is neutral today. Our short-term outlook is neutral, and our medium-term outlook is neutral:
Intraday outlook (next 24 hours): neutral
Short-term outlook (next 1-2 weeks): neutral
Medium-term outlook (next 1-3 months): neutral
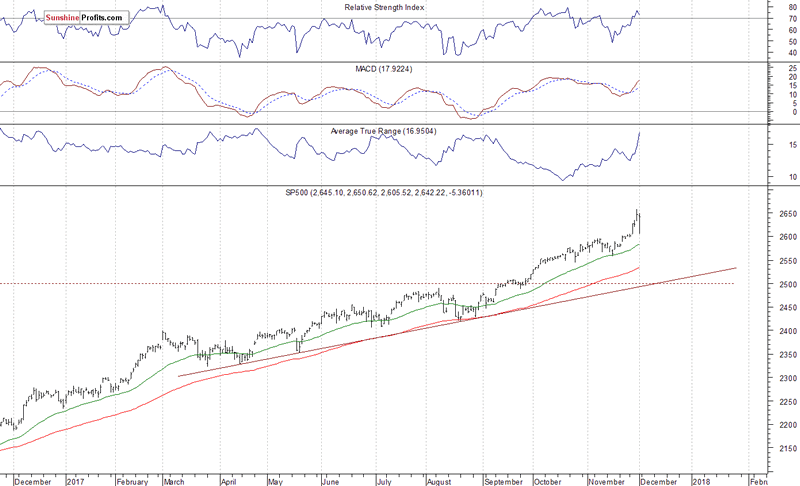
The main U.S. stock market indexes lost between 0.2% and 0.4% on Friday, following volatile trading session, as investors took short-term profits off the table. The S&P 500 index retraced most of its last week's rally, as it got close to 2,600 mark, before sharply bouncing off that support level and closing relatively neutral vs. Thursday's closing price. The index trades around 0.6% below its Thursday's new record high of 2,657.74. The Dow Jones Industrial Average remains relatively stronger than the broad stock market after last week's Tuesday-Thursday's rally to new all-time high at the level of 24,327.82. It retraced some of this move up on Friday, before closing just 0.4% below Thursday's record high. The technology Nasdaq Composite was relatively weak, as it lost 0.4% following intraday move down below the level of 6,750. The nearest important level of support of the S&P 500 index is at around 2,630-2,635, marked by some recent local highs. The next support level remains at 2,600-2,610, marked by Friday's local low. The support level is also at at 2,590, marked by last Tuesday's daily gap up of 2,584.64-2,589.17. On the other hand, resistance level is at around 2,650-2,660, marked by all-time high. Will the S&P 500 index continue its uptrend following Friday's fluctuations? Or is this some topping pattern before medium-term downward correction? There have been no confirmed negative signals so far. However, we still can see medium-term technical overbought conditions along with negative technical divergences:
Very Positive Expectations
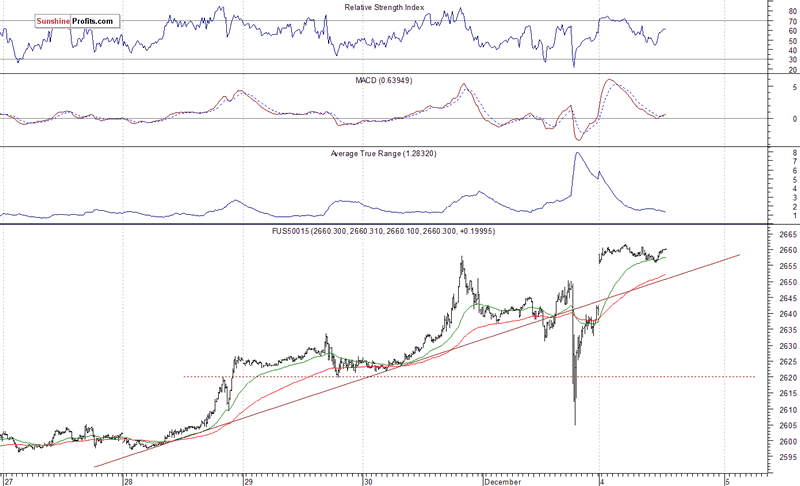
Expectations before the opening of today's trading session are positive, with index futures currently up 0.5-0.8% vs. their Friday's closing prices, as investors react to tax plan's progress. The European stock market indexes have gained 0.8-1.2% so far. Investors will wait for the Factory Orders number release at 10:00 a.m. The market expects that it fell 0.3% in October. The S&P 500 futures contract trades within an intraday consolidation, following overnight move up. The nearest important level of support is at 2,650-2,655, marked by local lows. The next support level is at 2,640, marked by Friday's closing price, among others. On the other hand, resistance level is at around 2,560. The futures contract trades along its new record high, as we can see on the 15-minute chart:
Nasdaq Remains Weaker
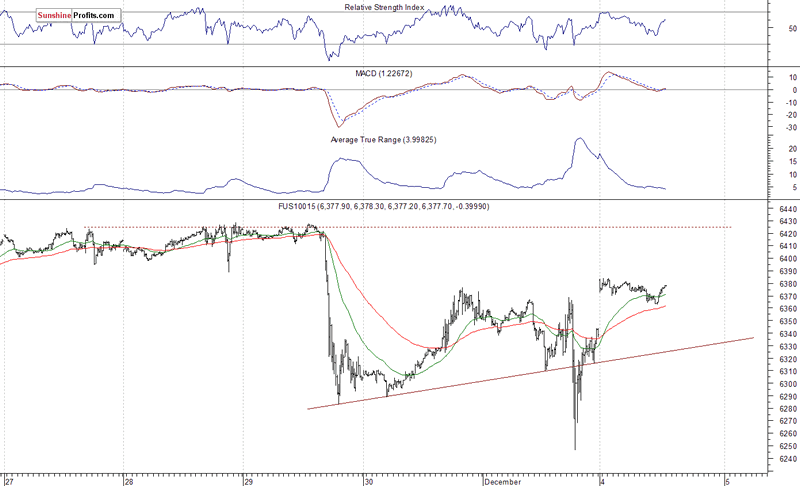
The technology Nasdaq 100 futures contract follows a similar path, as it trades higher following Friday's intraday downward correction. However, the market remains well below its last week's all-time high above the level of 6,400. The nearest important level of resistance is at around 6,380-6,400, and the next resistance level is at 6,420-6,430. On the other hand, support level is at 6,300-6,350. The Nasdaq 100 futures contract retraces some of its Wednesday's move down, as the 15-minute chart shows:
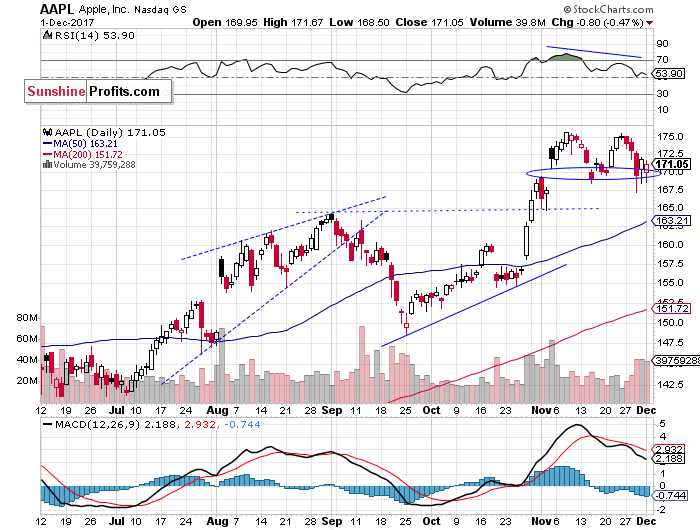
Let's take a look at Apple, Inc. stock (AAPL) daily chart (chart courtesy of http://stockcharts.com). The price reached new record high on November 8, as it extended its uptrend following better-than-expected quarterly earnings release. Since then it fluctuates below the record high. Is this a topping pattern or just consolidation before another leg up? The price keeps bouncing off support level, marked by the early November daily gap up:
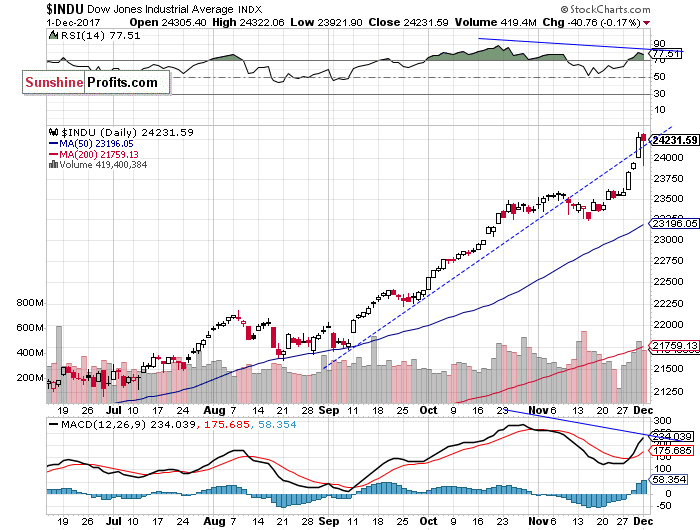
The Dow Jones Industrial Average daily chart (chart courtesy of http://stockcharts.com) shows that blue-chip index broke above its recent consolidation and reached new record highs above 24,000 mark last week. We still can see negative technical divergences. The most common divergences are between asset’s price and some indicator based on it (for instance the index and RSI based on the index). In this case, the divergence occurs when price forms a higher high and the indicator forms a lower high. It shows us that even though price reaches new highs, the fuel for the uptrend starts running low:
Concluding, the S&P 500 index lost 0.2% on Friday, following volatile trading session. The market retraced most of its last week's gains, before bouncing off support level at around 2,600. Overall, the broad stock market continued its uptrend last week. We still can see medium-term overbought conditions along with negative technical divergences. However, there have been no confirmed negative signals so far.
If you enjoyed the above analysis and would like to receive free follow-ups, we encourage you to sign up for our daily newsletter – it’s free and if you don’t like it, you can unsubscribe with just 2 clicks. If you sign up today, you’ll also get 7 days of free access to our premium daily Gold & Silver Trading Alerts. Sign up now.
Thank you.
Paul Rejczak
Stock Trading Strategist
Stock Trading Alerts
SunshineProfits.com
Stock market strategist, who has been known for quality of his technical and fundamental analysis since the late nineties. He is interested in forecasting market behavior based on both traditional and innovative methods of technical analysis. Paul has made his name by developing mechanical trading systems. Paul is the author of Sunshine Profits’ premium service for stock traders: Stock Trading Alerts.
* * * * *
Disclaimer
All essays, research and information found above represent analyses and opinions of Paul Rejczak and Sunshine Profits' associates only. As such, it may prove wrong and be a subject to change without notice. Opinions and analyses were based on data available to authors of respective essays at the time of writing. Although the information provided above is based on careful research and sources that are believed to be accurate, Paul Rejczak and his associates do not guarantee the accuracy or thoroughness of the data or information reported. The opinions published above are neither an offer nor a recommendation to purchase or sell any securities. Mr. Rejczak is not a Registered Securities Advisor. By reading Paul Rejczak’s reports you fully agree that he will not be held responsible or liable for any decisions you make regarding any information provided in these reports. Investing, trading and speculation in any financial markets may involve high risk of loss. Paul Rejczak, Sunshine Profits' employees and affiliates as well as members of their families may have a short or long position in any securities, including those mentioned in any of the reports or essays, and may make additional purchases and/or sales of those securities without notice.
Paul Rejczak Archive |
© 2005-2022 http://www.MarketOracle.co.uk - The Market Oracle is a FREE Daily Financial Markets Analysis & Forecasting online publication.