


Nvidia NVDA Correction is Around the Corner
Companies / Company Chart Analysis Dec 06, 2017 - 06:18 PM GMT

 The American semiconductors company Nvidia (NASDAQ: NVDA) is specialized is designing graphics processing units (GPUs) for the gaming, cryptocurrency, and professional markets, as well as system on a chip units (SoCs) for the mobile computing and automotive market.
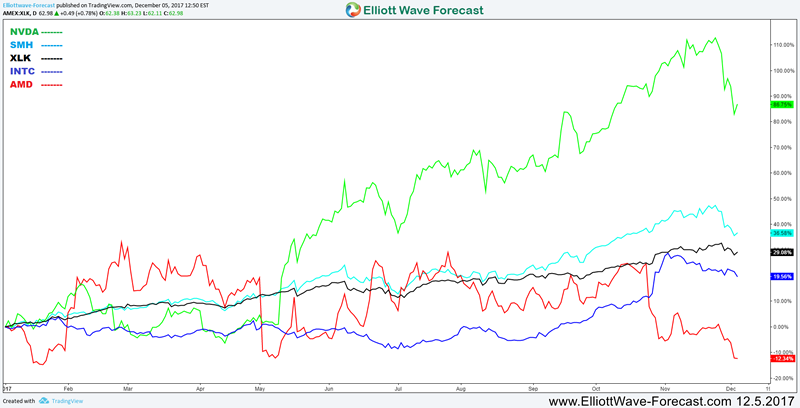
Nvidia is considered as one of the strongest technology companies this year and its stock NVDA enjoyed a great rally this year despite the recent 15% pullback. If we compare NVDA performance for this year to its main competitors Intel (INTC) and Advanced Micro Devices (AMD) then we can notice how strong the company has been this year, as well as outperforming both the Technology Select Sector SPDR ETF (XLK), which is the best performer sector for 2017, and The VanEck Vectors Semiconductor ETF (SMH) which contains the mega-cap semiconductors companies.
To understand the current situation for the Stock, we’ll explain the technical chart using Elliott Wave Theory and present 2 possible scenarios that could be taking place by the end of this year:
1st Scenario: NVDA Ending Diagonal
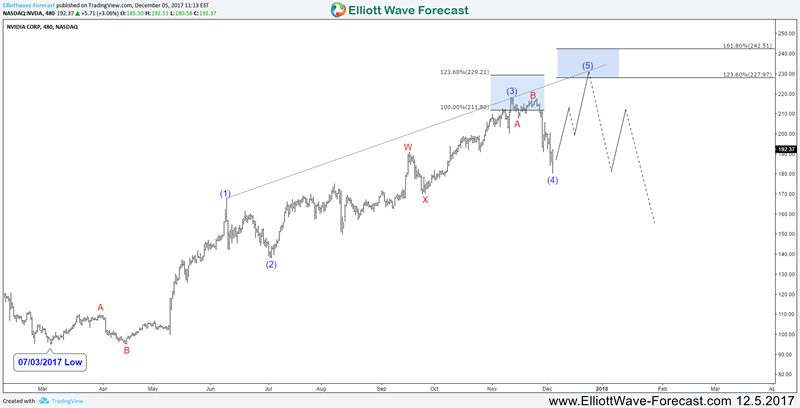
In the chart above, we are presenting the cycle from July low as 5 waves ending diagonal structure which is still incomplete. The move is missing another leg higher toward extreme area $227 – $242 where the stock will be expected to end that cycle and start a 3 waves correction at least.
2nd Scenario: NVDA Double Three
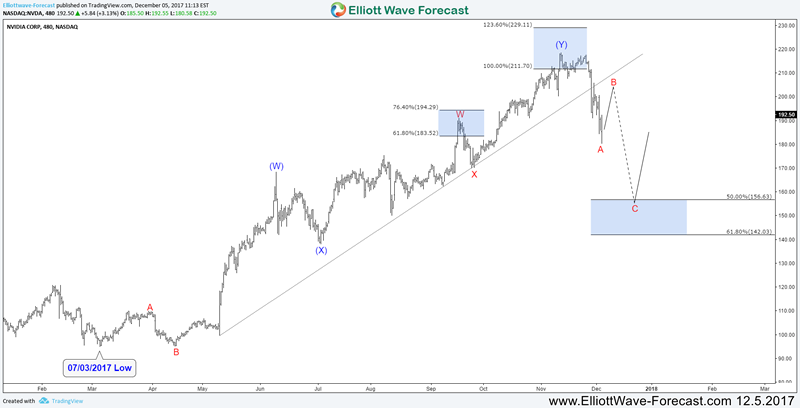
In the second chart, we are considering the cycle from July low completed as 7 swings double three structure after it reached equal legs area $211 – $229. Therefore the stock already started the correction lower with the first leg taking place during the recent decline. In this case, NVDA short term bounce is expected to fail below the recent $218 peak to be able to extend the correction lower toward the 50%-61.8% Fibonacci retracement of the rally around $156 – $142 area.
Conclusion
Nvidia short term analysis is suggesting a correction to take place either after making new all time highs or the pullback is already in progress. Consequently buyers need to be careful during the next period and it would be wise to wait for a clear corrective structure to take place before re-entering the long side.
If you enjoy this article, check our work and join Free 14 days Trial to see Elliott Wave Forecast in 78 instrument, as well as getting access to Live Trading Room, Live Session, and more.
By Ayoub Ben Rejeb
https://elliottwave-forecast.com
ElliottWave-Forecast has built its reputation on accurate technical analysis and a winning attitude. By successfully incorporating the Elliott Wave Theory with Market Correlation, Cycles, Proprietary Pivot System, we provide precise forecasts with up-to-date analysis for 52 instruments including Forex majors & crosses, Commodities and a number of Equity Indices from around the World. Our clients also have immediate access to our proprietary Actionable Trade Setups, Market Overview, 1 Hour, 4 Hour, Daily & Weekly Wave Counts. Weekend Webinar, Live Screen Sharing Sessions, Daily Technical Videos, Elliott Wave Setup .
Copyright © 2017 ElliottWave-Forecast - All Rights Reserved Disclaimer: The above is a matter of opinion provided for general information purposes only and is not intended as investment advice. Information and analysis above are derived from sources and utilising methods believed to be reliable, but we cannot accept responsibility for any losses you may incur as a result of this analysis. Individuals should consult with their personal financial advisors.
© 2005-2022 http://www.MarketOracle.co.uk - The Market Oracle is a FREE Daily Financial Markets Analysis & Forecasting online publication.