4 Charts That Show How Trump Tax Cuts Will Trigger A Recession
Economics / Recession 2018 Dec 08, 2017 - 10:16 AM GMTBy: John_Mauldin
 BY PATRICK WATSON : Not so long ago, I explained why tax cuts won’t stimulate the economy as much as Republicans think.
In short, most CEOs say they will use any tax savings for stock buybacks or dividends, not new hiring or expansion.
But what if, instead of little or no growth, this tax bill sets off an outright contraction?
Recession Is Already Overdue
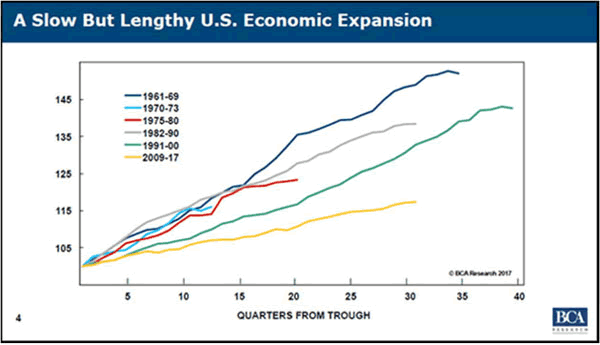
The current economic expansion is now the third-longest since World War II. It’s also the weakest. Here’s a chart I showed last summer.

Source: BCA Research
The yellow line is the current recovery that began in 2009. Only the 1960s and 1990s growth periods went on longer—and both had much higher growth.
So, just by length of time, we’re already due or overdue for recession. Yes, the economy could improve further from here… but probably not for long.
Our Economy Has Reached Maximum Potential Output
In addition to GDP, economists track what is called “Potential GDP.” That’s how fast the economy is capable of growing, considering the number of available workers, productivity, and other factors.
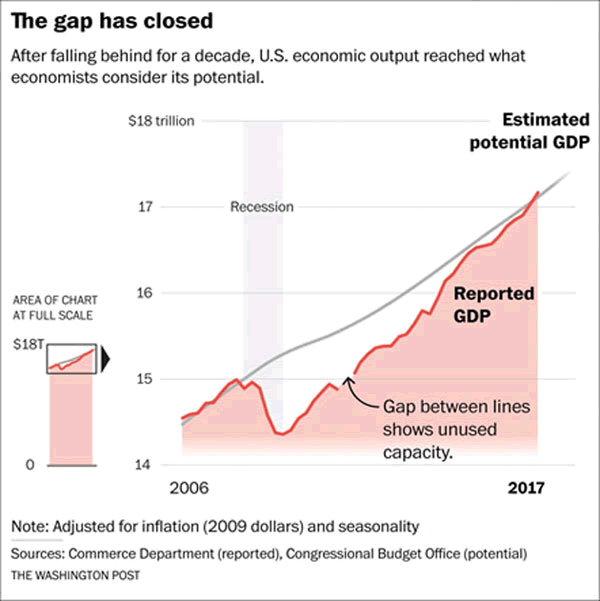
If subsequent data confirms last quarter’s 3.3% growth of inflation-adjusted GDP, it will mark the first time the US economy achieved “maximum sustainable output” since 2007.
On the chart below, the gap between the gray line (potential GDP) and the red line (actual GDP) represents unused capacity.

Image: Washington Post
You can see we had a lot of it at the recession’s 2009 depth. The gap slowly shrank since then. Now it’s closed.
Great news, right? Yes, it is—but don’t celebrate just yet.
The End Is Near
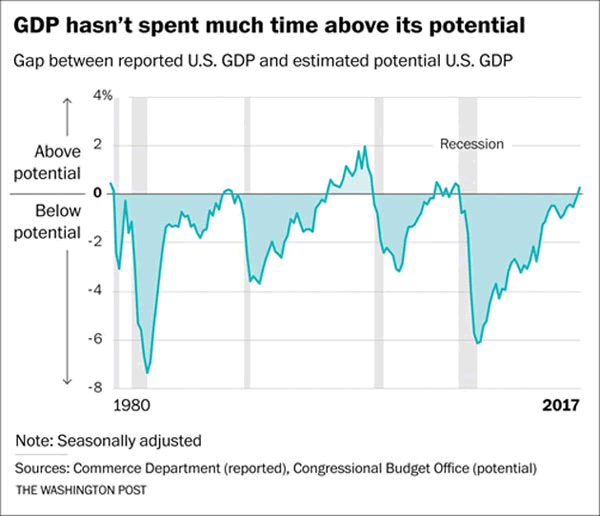
Actual GDP can’t stay above potential GDP for long before bad things start happening. This chart proves it:

Image: Washington Post
We see here how GDP moved above and below its potential since the 1970s. Notice that each time the green line went above zero, a recession (the gray bars) began soon after.
“Soon” can vary, of course. GDP ran above potential for extended periods in the late 1990s and 2006–2007, but in both cases, intense downturns followed. Plus, the Fed wasn’t tightening as it is now—which suggests the current expansion is at least approaching its endpoint.
4% Growth Is Nonsense
The Trump administration and congressional Republicans disagree, saying their tax changes will stimulate years of economic growth and more than pay for themselves.
President Trump himself said last month he thought growth could reach 4% and even “quite a bit higher.”
I agree we may get a quarter or two of 4% real annualized growth. But will it continue for years? Probably not, unless potential GDP takes a big leap.
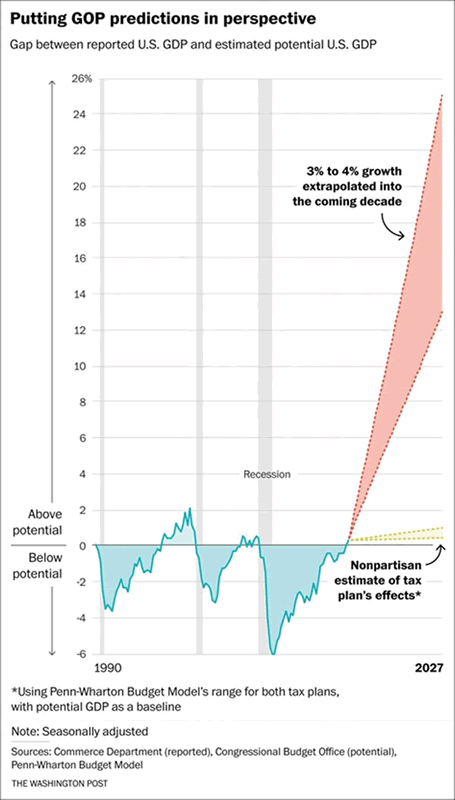
Here is the potential GDP chart above, extrapolating the future as it would look with 3–4% growth over the next decade.

Image: Washington Post
I’m sorry this chart is so tall, but that red triangle is necessary to project as much growth as the president anticipates and that Congress says will pay for the tax cuts. The smaller yellow fan below it is the less thrilling estimate of nonpartisan economists.
In either case, to do what the Republicans predict, GDP must grow above potential for years, unless potential GDP rises in a similarly spectacular fashion.
That’s not impossible: a major technology breakthrough might do it. But just as likely, a recession, natural disaster, war, or other shock could sharply reduce GDP. The projections above don’t account for that possibility.
Actual GDP can outpace potential GDP at the end of a cycle, but by definition, such growth is unsustainable. The inputs to higher production—available workers, productivity—can’t grow fast enough, so those booms end up going “boom.”
Recession Triggers
Here’s where we are:
- The current expansion is long in the tooth, suggesting a recession could start anytime.
- GDP growth is running above potential, which also points to recession in the near future.
- The Fed is tightening, soon to be joined by other central banks.
- Treasury borrowing will likely increase in the next few years as deficits rise.
- Bitcoin and other cryptocurrencies look increasingly bubble-like.
All that is happening even if we get no surprises. War with North Korea, a NAFTA breakup, Chinese banking crisis, a hard Brexit—any of those could extinguish global growth.
My main fear as we entered 2017 was that the Fed would tighten too much and too fast, pushing the economy into a deflationary recession. I still think that’s the most likely scenario.
With this tax bill passes in its current form, the recession may happen sooner and go deeper. The combined fiscal and monetary tightening could be the triggers.
However, first we might get a sugar-high inflationary rally, which could last a while. GDP ran above potential for four years in the late 1990s and for over a year in the housing craze.
Those were fun times while they lasted. Then the fun stopped.
One thing I’m positive won’t happen is another 10 years of uninterrupted 3% or 4% real GDP growth, as politicians so glibly promise.
That’s pure fantasy.
Free Report: The New Asset Class Helping Investors Earn 7% Yields in a 2.5% World
While the Fed may be raising interest rates, the reality is we still live in a low-yield world. This report will show you how to start earning market-beating yields in as little as 30 days... and simultaneously reduce your portfolio’s risk exposure.
John Mauldin Archive |
© 2005-2022 http://www.MarketOracle.co.uk - The Market Oracle is a FREE Daily Financial Markets Analysis & Forecasting online publication.


