


Stock Selloffs Great for Gold
Stock-Markets / Stock Markets 2018 Jan 12, 2018 - 06:21 PM GMTBy: Zeal_LLC

 The stock markets have rocketed higher since Trump’s election win on hopes for big corporate tax cuts. This extreme rally has left stocks exceedingly overvalued and overbought today. A major selloff is long overdue and likely imminent. When stocks inevitably roll over and mean revert lower to rebalance away euphoric sentiment, gold is the main beneficiary. Gold investment demand soars when stocks materially slide.
Two trading days before the November 2016 presidential election, I published an essay that explored how stock-market action leading into elections really sways their results. Its conclusion based on long market history was “The stock markets overwhelmingly and conclusively predict Donald Trump will win!” That was a hardcore contrarian stance before Election Day, when such an upset seemed impossible to most.
Since Americans voted for our next president, the flagship S&P 500 broad-market stock index (SPX) has soared 28.6% higher in 14.0 months! That extraordinary rally was mostly driven by hopes for big tax cuts soon with Republicans newly controlling the US government. And they indeed delivered last month with a massive corporate tax cut. That sets up a classic buy-the-rumor-sell-the-news scenario for these record markets.
Ever since that election, Wall Street has argued that stocks are surging due to strong corporate-profits growth. But that’s not true according to hard valuation data. In late October 2016 just before Americans voted, the 500 companies of the SPX averaged trailing-twelve-month price-to-earnings ratios of 26.3x. Even before Trump won, stocks were already very expensive and nearing dangerous bubble territory.
For the past century and a quarter, average broad-market TTM P/E ratios have run 14x earnings. That’s fair value for stock markets, and twice that at 28x is formally bubble territory. Rather ironically during his campaign, Trump often warned about the stock-market bubble created by the Fed! While he loves these same stock markets now, they are a lot more expensive after this past year’s massive taxphoria-fueled rally.
2017 indeed proved a strong year for corporate profits as optimistic Americans spent money fast. Yet at the end of December a couple weeks ago, the elite SPX companies were averaging a TTM P/E way up at 30.7x! That’s well into bubble territory, and history has proven stock markets never fare well for long after valuations are bid up to such unsustainable extremes. That guarantees a major stock selloff looms.
Over roughly the same post-election span where the SPX blasted up 28.6%, SPX valuations rose 16.8%. That means about 6/10ths of the rally was driven by multiple expansion, higher valuations. Only 4/10ths can be attributable to rising corporate earnings, and even that is suspect. The economic optimism that was unleashed by the Republican sweep was huge, driving big spending. But that anomaly won’t last for long.
And the Republicans’ corporate tax cuts won’t magically rescue stocks. While good news for the US economy, they won’t do enough to work off today’s extreme bubble valuations. Wall Street estimates are generally for 10% corporate-profits growth this year due to lower taxes. That would merely push the SPX P/E back to 27.6x, near-bubble levels. Stocks are now way too expensive for corporate tax cuts to help much!
As the stock markets surged into the tax-reform bill’s actual passage in recent months, contrarian traders assumed any stock selling was being delayed. Why realize big capital gains in 2017 if tax rates might be significantly lower in 2018? But the stock markets have blasted even higher so far in January, with no meaningful selling yet materializing. That has left the SPX extremely overbought technically, a bearish omen.
In the first 4 trading days of 2018, the SPX surged another 2.6% higher. That’s truly an extreme rate of ascent by any standard. There are about 250 trading days per year, so annualize out these early-year gains and the SPX is skyrocketing at a 163% yearly rate! Obviously there’s zero chance 2018 could see such absurd gains. Ominously such a fast climb looks parabolic for a stock index as enormous as the SPX.
In late December the collective market capitalization of those 500 SPX companies was $24.4t. Such a vast number gives the stock markets great inertia. So a parabolic surge in the general stock markets will always be relatively muted. Unlike vastly-smaller assets like bitcoin, stock markets are far too large to catapult higher in the terminal phases of bull markets. The SPX’s early-2018 action has truly been extreme.
The stock markets are now dangerously overbought, implying a major selloff is probable and imminent. Overboughtness happens when stock markets surge too far too fast to be sustainable. There are many ways to measure overboughtness, but one of the best is looking at price levels relative to their own key moving averages. Well over a decade ago I developed Relativity Trading to empirically define this state.
200-day moving averages are probably the best price baselines over time, striking an excellent balance between filtering out daily noise and following long-term trends in force. A construct I call the Relative SPX looks at this dominant stock index as a multiple of its 200dma. It is simply calculated by dividing the SPX by its underlying 200dma each day. Charting the results over time yields illuminating trading insights.
In any trending market, prices tend to meander in well-defined ranges relative to their 200dmas. When they stretch too far above their 200dmas by their own historical standards, sharp selloffs soon follow to restore normalcy and rebalance sentiment. This chart superimposes the SPX itself in blue over the rSPX in red, highlighting the extreme overboughtness in the stock markets after early January’s euphoric surge.
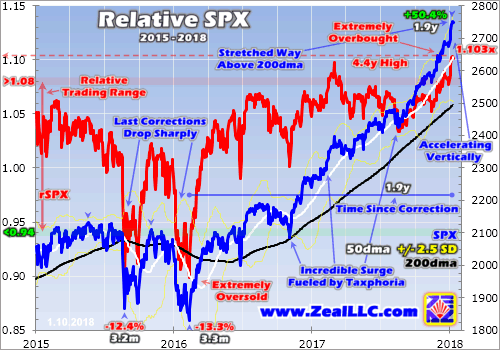
The Relative SPX effectively flattens the SPX’s black 200dma line at 1.00x, and shows where the SPX is trading relative to that 200dma in perfectly-comparable percentage terms over time. As of this week, the rSPX soared as high as 1.103x! In other words, the mighty S&P 500 was stretched 10.3% above its key 200dma. Such extremes are very unusual and never sustainable for long, signaling major selloffs looming.
Relativity Trading looks at the past five calendar years’ trading action to define a relative range. For the SPX that now runs from 0.94x to 1.08x. When the SPX falls down near or under 94% of its 200dma, it’s very oversold so a major rally is very likely soon. But when the SPX climbs up near or over 108% of its 200dma, it’s very overbought heralding an imminent major selloff. Such fast price rises simply can’t persist.
This week’s rSPX levels hit a 4.4-year high, which might not sound too extreme. But other things need to be taken into consideration when high rSPX levels are reached. The trajectory of the 200dma is one of the most important. While 200dmas mostly rise in bull markets, that’s not always the case. Early in young bull markets 200dmas are still falling from the preceding bears. 200dmas can also drift lower in major corrections.
The last SPX corrections erupted in mid-2015 and early 2016, when the stock markets fell 12.4% in 3.2 months followed by another 13.3% in 3.3 months. A correction is technically a 10%+ SPX selloff. That pushed SPX levels low enough for long enough to drag its 200dma lower for the better part of several quarters. When stocks started rallying again, the rSPX shot to high levels before the 200dma fully turned higher.
Most rSPX extremes are seen early in bull markets or after corrections when stock prices surge higher before a declining or flat 200dma has time to catch up. But that certainly isn’t the case this year. The SPX’s 200dma has been rising sharply ever since Trump won the election in November 2016. Today’s rSPX extreme is much worse than it sounds because it’s coming from a high 200dma after a powerful rally!
Normal healthy bull markets see corrections once a year or so, when prices fall back to their 200dmas to work off greed and restore sentiment balance. Today’s SPX would have to drop more than 10% just to revisit its 200dma, a major selloff by recent standards. It’s been 1.9 years since the end of the SPX’s last correction, so the next one is long overdue. Extremely-overbought conditions like today help birth major corrections.
Considering how far and fast stock markets have rallied, how euphoric and complacent traders are today, and how extremely expensive today’s bubble-valued stock markets are, it’s hard to imagine the overdue and coming major selloff not at least testing the upper limits of corrections. That portends a selloff that nears 20%, which is probably the best-case scenario for the bulls. Anything beyond 20% is a new bear market.
And unfortunately that new-bear scenario is far more likely. As of this week this SPX bull has rocketed up an extreme 306.7% in 8.8 years, making for the third-largest and second-longest stock bull in all of US history! Much of those gains were fueled by epic central-bank easing far beyond anything ever before seen in world history. This year both the Federal Reserve and European Central Bank are slamming on the brakes.
The Fed just started its first-ever quantitative-tightening campaign in Q4’17 to unwind years and trillions of dollars of quantitative easing. QT is going to gradually ramp up in 2018 to a powerful $50b-per-month pace starting in Q4 this year. Per the Fed’s schedule, it will effectively destroy $420b of capital in 2018 by letting QE-purchased bonds roll off its balance sheet. Nothing remotely close has ever happened before!
On top of that the ECB just slashed in half its own QE campaign this month to a €30b monthly pace, with a targeted QE end date of September. That means ECB QE will collapse from €720b in 2017 to just €270b in 2018, a radical 5/8ths plunge. Between the Fed’s QT and ECB’s QE tapering, there will be the equivalent of $950b more tightening and less easing in 2018 compared to 2017! That’s going to leave a mark.
The Fed and ECB will literally strangle this stock bull by unwinding and slowing the QE that grew it. And this isn’t just a 2018 thing. In 2019 the Fed and ECB are on track to have another $1450b of tightening compared to 2017. So these stock markets are in real trouble with central-bank liquidity being pulled regardless of their extreme overvaluations and overboughtness. 2018 sure ain’t gonna look like 2017 at all!
Bear markets ultimately tend to cut stock prices in half, literal 50% losses in the SPX. The last couple bears that started in early 2000 and late 2007 saw the SPX drop 49.1% in 2.6 years and 56.8% in 1.4 years! Bear markets are exceedingly dangerous and not to be trifled with. They also tend to grow in size in proportion to their preceding bulls, so the next bear should be bigger than usual after such a massive bull.
A major stock selloff imminent, whether a serious correction or new bear, certainly sounds like bad news for investors. But like everything else in the markets, it offers huge opportunities to profit for contrarians who see it coming and prepare. A great Bible verse that applies to the inexorable stock-market cycles is Proverbs 27:12, “The prudent see danger and take refuge, but the simple keep going and pay the penalty.”
When stock markets start materially weakening, investors return to gold. Gold is the ultimate portfolio diversifier because it tends to move counter to stock markets. Gold is forgotten when stock markets are high and euphoria and complacency abound. But once major selloffs inevitably follow major rallies, gold demand explodes as investors rush to diversify their stock-heavy portfolios. Gold is effectively the anti-stock trade.
As you’d imagine with today’s taxphoria-crazed stock markets, gold investment is really low. One metric to approximate stock investors’ capital deployed in gold is the ratio between the SPX’s market cap and the value of the leading GLD SPDR Gold Shares gold ETF. At the end of December, those 500 elite SPX companies were collectively worth $24,432.5b. That dwarfs the meager capital now deployed in GLD shares.
GLD exited 2017 holding 837.5 metric tons of physical gold bullion in trust for its shareholders. That was worth just $35.1b at $1302 gold. That means only 0.14% of the stock-market capital invested in the SPX companies is invested in the world’s leading gold ETF. I’ve studied the history of this ratio, and it is usually much higher. From 2009 to 2012 for example, GLD holdings’ value averaged 0.48% of SPX market cap.
So there’s no doubt today’s stock investors are radically underinvested in gold. They couldn’t care less about it when stocks apparently do nothing but rally indefinitely. But once the next major stock selloff arrives, gold investment will quickly return to favor. This chart looks at the SPX and gold over the past few years. The last major stock-market correction was actually the catalyst that birthed today’s gold bull!
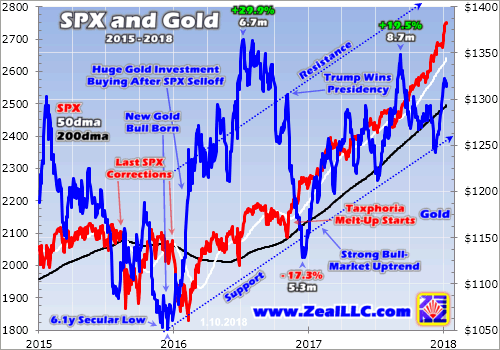
Mid-2015 was similar to late 2017 in stock-market terms. The SPX was relentlessly powering to endless new record highs while volatility was exceptionally low. Like today, stock traders were excessively bullish and hyper-complacent. It had been a near-record 3.6 years since the last correction, so people foolishly assumed stock-market cycles had vanished. Yet not even extreme central-bank easing can eliminate cycles.
That’s because they are ultimately fueled by the herd behavior of greedy and fearful humans. As long as these powerful warring emotions drive collective trading decisions, stock-market cycles will persist. Gold was despised in that record-stock-market environment, ultimately slumping to a deep 6.1-year secular low late that year. Gold-futures speculators were deeply afraid of the Fed’s coming first rate hike of this cycle.
But when the stock markets finally started falling again, triggered by sharp selloffs in the Chinese stock markets, gold rocketed higher. Stock investors watching their portfolios bleed rushed to get back some gold exposure to mitigate the stock losses. They flooded back into gold with a vengeance, catapulting it 29.9% higher in just 6.7 months in essentially the first half of 2016. That gold-bull uptrend continues today.
In Q4’15 when gold was largely forgotten and despised, GLD’s holdings fell 45.0 metric tons or 6.6%. But in Q1’16 after stock markets corrected sharply, GLD’s holdings soared 176.9t or 27.5% higher! Gold investment demand turned on a dime, and the trigger was the last stock-market correction. Stock selloffs driving surging gold buying is nothing new, so gold will certainly rally again in and after the next SPX correction.
When stock investors want gold exposure fast, they naturally turn to GLD. This gold ETF acts as conduit for the vast pools of stock-market capital to slosh into and out of gold. GLD’s mission is to track the gold price. So when stock investors buy GLD shares at faster rates than gold is rising, this ETF’s price will soon decouple to the upside and fail its mission. GLD’s managers prevent this by shunting that buying into gold.
When GLD-share demand exceeds gold’s own, GLD issues new shares to offset and absorb the excess. The capital raised from these sales is used to directly buy more physical gold bullion for GLD to hold in trust for its shareholders. Big GLD buying by American stock investors alone catapulted gold’s price far higher in Q1’16. That 176.9t surge in GLD’s holdings accounted for 95.2% of the total jump in world gold demand!
So if today’s literally-bubble-valued extremely-overbought hyper-complacent stock markets concern you, start upping your gold allocation before everyone else does. Since gold rallies when stock markets sell off, it’s the ultimate portfolio diversifier. While forgotten when stock markets are high and euphoric, gold is quickly remembered and returned to once material stock selloffs inevitably erupt. Early contrarians win big.
In roughly the first half of 2016 after the last SPX correction, gold again powered 29.9% higher. Investors could’ve easily played that in GLD shares. But when gold rallies significantly, the greatest gains are won in the gold miners’ stocks. Their profits are really leveraged to prevailing gold prices, so their stocks tend to amplify gold gains by 2x to 3x. In roughly the first half of 2016, the leading gold-stock index soared 182.2% higher!
With these taxphoria-inflated stock markets hyper-risky today, the potential upside in gold stocks is huge. This sector is often the only big winner during major stock-market selloffs, whether just bull corrections or full-on bear markets. Gold investment demand surges when stock markets materially sell off, driving gold sharply higher. The great gold miners’ stocks with superior fundamentals greatly leverage gold’s gains.
At Zeal we’ve literally spent tens of thousands of hours researching individual gold stocks and markets, so we can better decide what to trade and when. As of the end of Q3, this has resulted in 967 stock trades recommended in real-time to our newsletter subscribers since 2001. Fighting the crowd to buy low and sell high is very profitable, as all these trades averaged stellar annualized realized gains of +19.9%!
The key to this success is staying informed and being contrarian. That means buying low before others figure it out, before undervalued gold stocks soar much higher. An easy way to keep abreast is through our acclaimed weekly and monthly newsletters. They draw on my vast experience, knowledge, wisdom, and ongoing research to explain what’s going on in the markets, why, and how to trade them with specific stocks. For only $12 per issue, you can learn to think, trade, and thrive like contrarians. Subscribe today, and get deployed in the great gold and silver stocks in our full trading books!
The bottom line is stock selloffs are great for gold. This leading alternative investment is ignored when stocks are high. But since it rallies when stocks weaken, demand soars for portfolio diversification during material stock selloffs. Gold is ready to power higher again once these extreme stock markets inevitably roll over. The next major selloff is imminent given the bubble valuations and extreme overboughtness today.
Republicans’ new corporate tax cuts are good news for the economy, but they won’t boost profits anywhere near enough to work off these dangerous overvaluations. And with the Fed and ECB both engaging in unprecedented tightening campaigns this year, stock markets face fierce monetary headwinds. Gold is the best place to take refuge and grow wealth as normal stock-market cycles finally resume again.
Adam Hamilton, CPA
So how can you profit from this information? We publish an acclaimed monthly newsletter, Zeal Intelligence , that details exactly what we are doing in terms of actual stock and options trading based on all the lessons we have learned in our market research. Please consider joining us each month for tactical trading details and more in our premium Zeal Intelligence service at … www.zealllc.com/subscribe.htm
Questions for Adam? I would be more than happy to address them through my private consulting business. Please visit www.zealllc.com/adam.htm for more information.
Thoughts, comments, or flames? Fire away at zelotes@zealllc.com . Due to my staggering and perpetually increasing e-mail load, I regret that I am not able to respond to comments personally. I will read all messages though and really appreciate your feedback!
Copyright 2000 - 2017 Zeal Research ( www.ZealLLC.com )
Zeal_LLC Archive |
© 2005-2022 http://www.MarketOracle.co.uk - The Market Oracle is a FREE Daily Financial Markets Analysis & Forecasting online publication.