


What Happens Next after February’s Stock Market Selloff
Stock-Markets / Stock Markets 2018 Mar 06, 2018 - 07:12 PM GMTBy: Troy_Bombardia

 The S&P 500 Total Return Index (including dividends) closed higher for 15 consecutive months from November 2016 to January 2017. This record ended in February thanks to the stock market’s correction.
Historically, these extremely long streaks of consecutive monthly gains were a bullish sign for the stock market.
Here are similar streaks in the S&P 500’s history.
- January 2018: 15 consecutive months of gains (present case).
- September 1995: 10 consecutive months of gains.
- May 1959: 15 consecutive months of gains.
- July 1954: 11 consecutive months of gains.
- May 1950: 12 consecutive months of gains.
- June 1943: 14 consecutive months of gains.
- March 1936: 12 consecutive months of gains.
Let’s look at these cases in detail. What happened to the S&P 500 after these streaks ended?
September 1995
This streak ended after 10 months of consecutive gains (S&P 500 Total Return Index).
The S&P 500’s next 22.4% “significant correction” began almost 3 years later in July 1998.
Here’s the S&P 500 on a weekly bar chart.
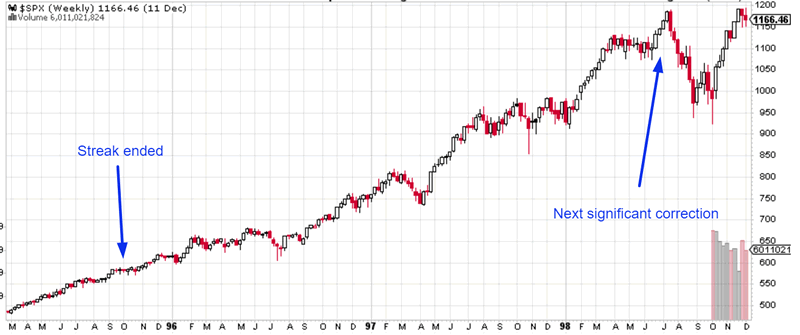
The next bear market began 4.5 years later in March 2000.
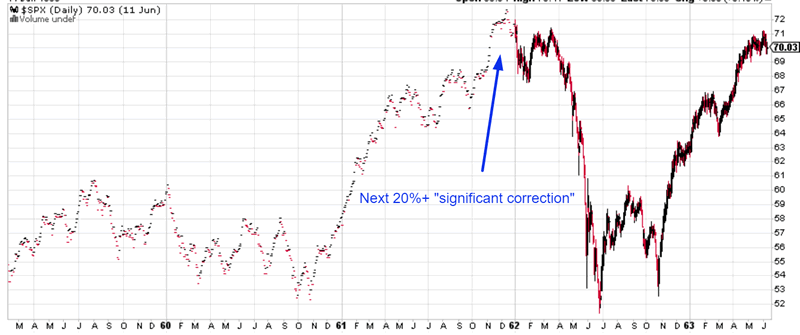
May 1959
This streak ended after 15 months of consecutive gains (S&P 500 Total Return Index).
The S&P’s next 14% “significant correction” began 2 months later in August. The S&P 500 made a new high in the interim.
Here’s the S&P 500 on a daily bar chart.
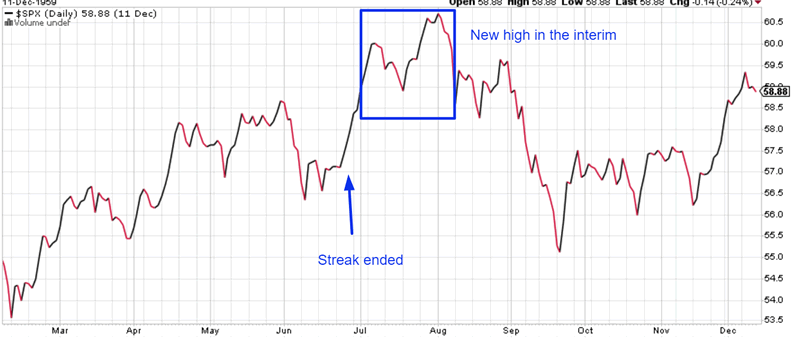
The next 29.3% “significant correction” began more than 2 yrs later in December 1962.
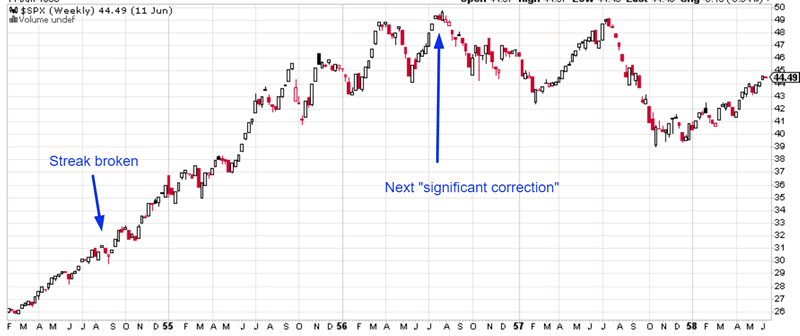
July 1954
This streak ended after 11 months of consecutive gains (S&P 500 Total Return Index).
The next 21.4% “significant correction” began 2 years later in August 1956.
Here’s the S&P 500 on a weekly bar chart.
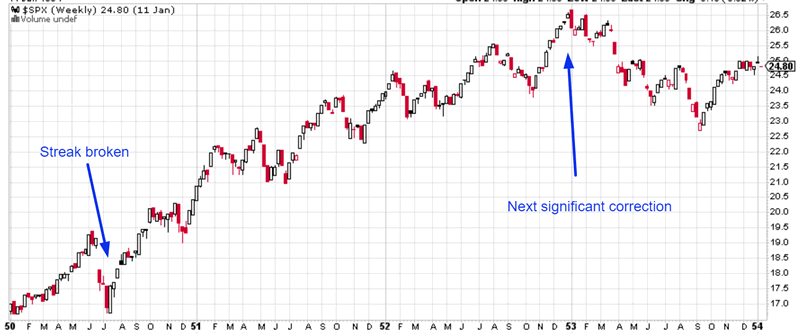
May 1950
This streak ended after 12 months of consecutive gains (S&P 500 Total Return Index).
The next 14.8% “significant correction” began more than 2.5 years later in January 1953.
Here’s the S&P 500 on a weekly bar chart.
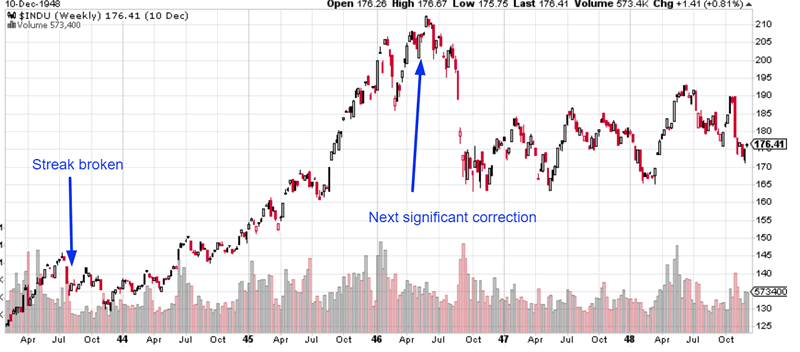
June 1943
This streak ended after 14 months of consecutive gains (S&P 500 Total Return Index).
The next 23.2% “significant correction” began almost 3 years later in May 1946.
Here’s the Dow Jones Industrial Average on a weekly bar chart. (The Dow is best for pre-1950 data).
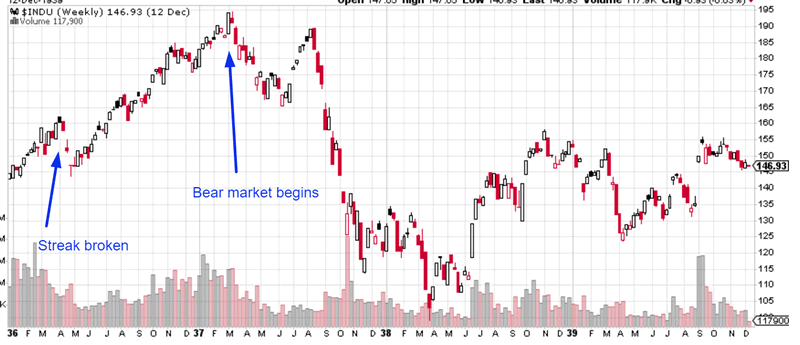
March 1936
This streak ended after 12 months of consecutive gains (S&P 500 Total Return Index).
The next bear market began almost 1 year later in March 1937.
Here’s the Dow Jones Industrial Average on a weekly bar chart. (The Dow is best for pre-1950 data).
Conclusion
This study suggests that the S&P 500 will soon make a new high. The next significant correction or bear market is AT LEAST months away. The Medium-Long Term Model agrees.
Long streaks of consecutive monthly gains mean that the stock market’s momentum is very strong. The first breakdown from strong momentum (i.e. ending the streak) is usually not the death knell for the stock market. Markets top after momentum has already weakened. In other words, markets top when there is a bearish divergence on a monthly bar chart.
By Troy Bombardia
I’m Troy Bombardia, the author behind BullMarkets.co. I used to run a hedge fund, but closed it due to a major health scare. I am now enjoying life and simply investing/trading my own account. I focus on long term performance and ignore short term performance.
Copyright 2018 © Troy Bombardia - All Rights Reserved
Disclaimer: The above is a matter of opinion provided for general information purposes only and is not intended as investment advice. Information and analysis above are derived from sources and utilising methods believed to be reliable, but we cannot accept responsibility for any losses you may incur as a result of this analysis. Individuals should consult with their personal financial advisors.
© 2005-2022 http://www.MarketOracle.co.uk - The Market Oracle is a FREE Daily Financial Markets Analysis & Forecasting online publication.