


Jeff Gundlach thinks that a Stocks Bear Market has started. Is he Right?
Stock-Markets / Stock Markets 2018 Dec 18, 2018 - 11:07 AM GMTBy: Troy_Bombardia

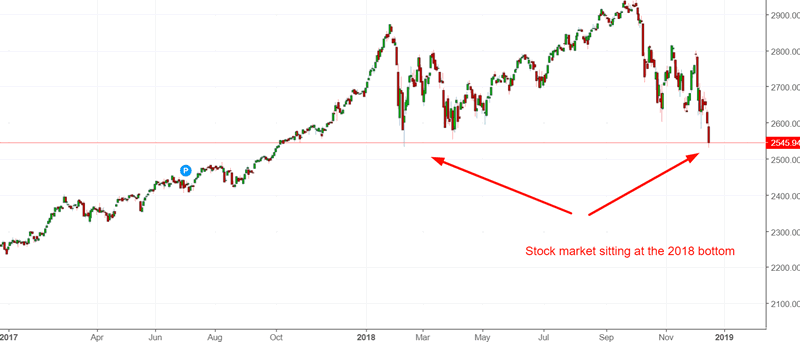
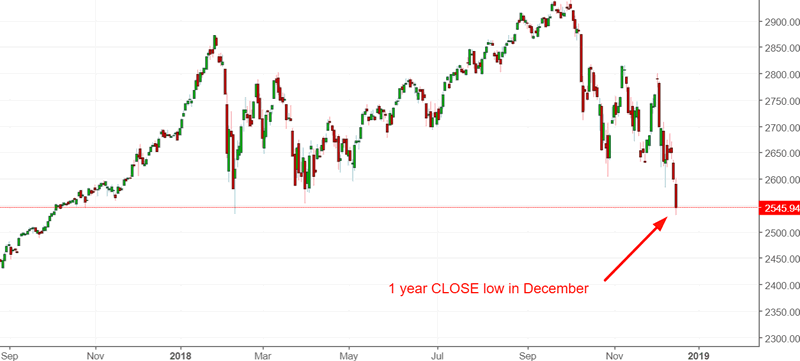
The S&P is now sitting at a 1 year low. And of course, traditional technical analysis states “if the S&P breaks below this support level, watch out below”.
Go here to understand our fundamentals-driven long term outlook.
Let’s determine the stock market’s most probable medium term direction by objectively quantifying technical analysis. For reference, here’s the random probability of the U.S. stock market going up on any given day, week, or month.

*Probability ≠ certainty. Past performance ≠ future performance. But if you don’t use the past as a guide, you are walking blindly into the future.
Crash in December
It’s not common for the stock market to tank in December because of the Santa Claus Rally seasonality. When it does tank in December, that is usually a bad sign for stocks.
Here’s what happens next to the S&P 500 when it drops to a 1 year low in December:
*Data from 1927 – present
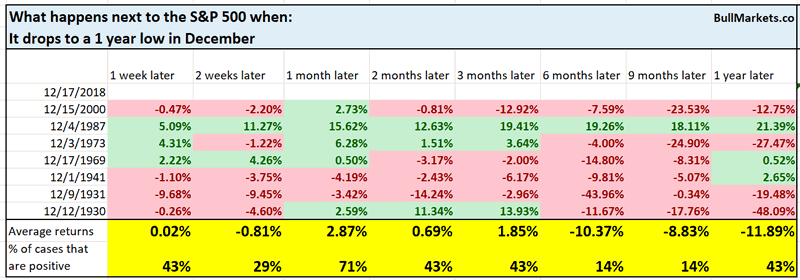
As you can see, forward returns are decidedly bearish 6 months later.
Here’s another way of looking at this.
Here’s what happens next to the S&P 500 when it has an intra-month drawdown of at least -8% in December.
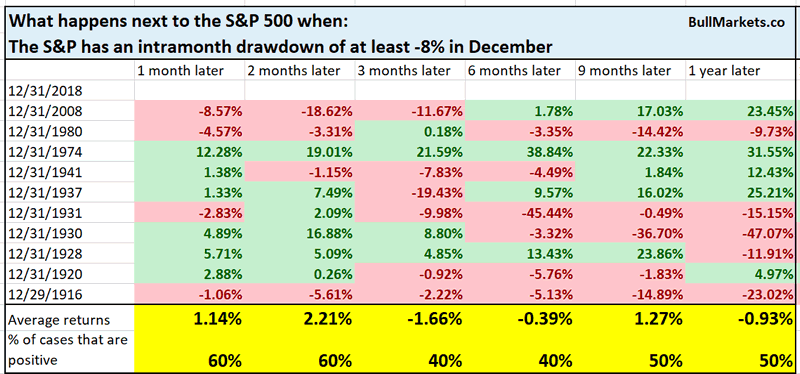
Once again, this has a slight bearish lean.
And lastly, this has been one of the worst declines in Q4. Big declines in Q4 are uncommon due to bullish seasonality.
Here’s every single case in which the S&P fell more than -13% in Q4, from 1900 – present.
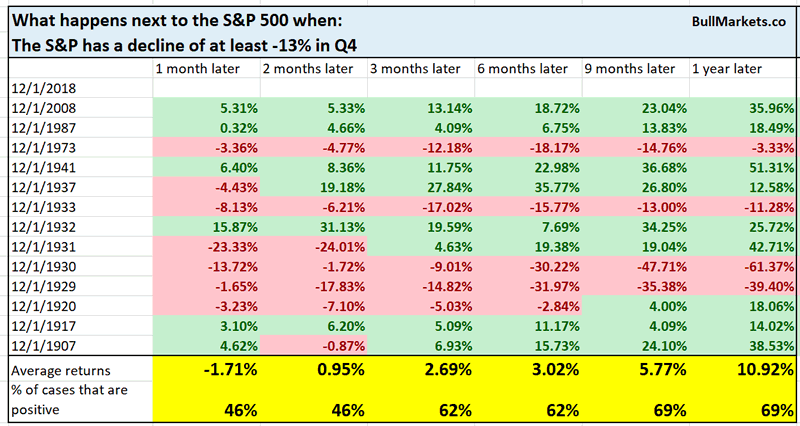
That’s a lot of bear market years. But interestingly enough, this isn’t consistently medium-long term bearish for stocks, because this often happened towards the end of bear markets.
Strong selloff
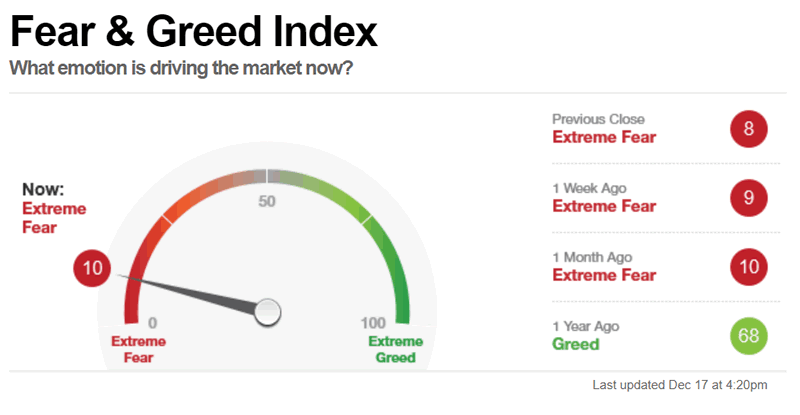
Such strong selloffs like the one right now is usually the setup for a medium term rally. Sentiment is fearful.
14 of the past 50 days have seen the S&P fall more than -2% on the intraday (today’s LOW vs. yesterday’s CLOSE). This is extremely uncommon when the S&P is within 15% of a 1 year high.
Here’s what the S&P did next, from 1962 – present
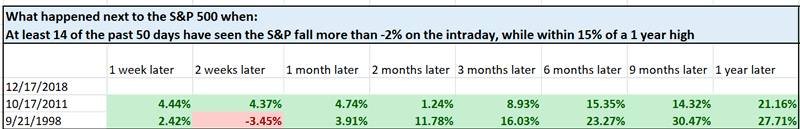
As you can see, the stock market rallied in both of those cases.
n = 2 (small sample size)
Homebuilders sentiment
The housing market has been deteriorating since August, and this downtrend is accelerating. For example, the NAHB Homebuilder Sentiment Index just slumped.
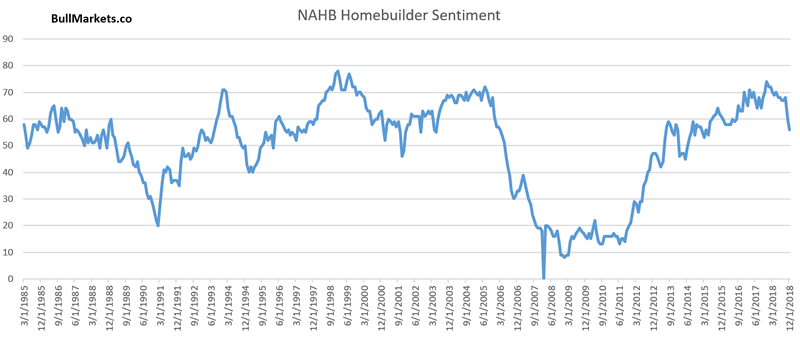
Over the past 2 months, the NAHB Index has fallen by -12 points, which is rare. From 1985 – present, this has only happened 3 other times.
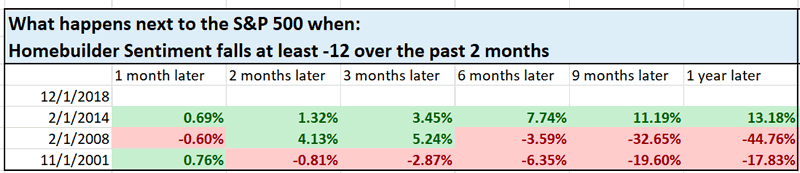
This is important because fundamentals are generally more useful than technicals. This suggests that housing – one of the key leading indicators in the economy – will continue to deteriorate throughout 2019.
Mean reversion that doesn’t always play out
The NASDAQ has seen a lot of big DOWN days over the past 50 days. Is this a sign that the stock market will mean-revert upwards?
Here’s what happened next to the S&P 500 when the NASDAQ saw at least 11 -2.5% days in the past 50 days.
*Data from 1971 – present
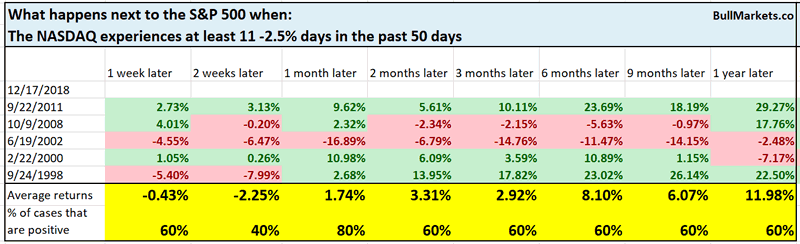
As you can see, the stock market tends to bounce 1 month later.
Here’s a similar study for the S&P 500.
Here’s what happened next to the S&P 500 when at least 3 of the past 10 days have seen the S&P fall more than -2%, while within 15% of a 1 year high.
*Data from 1928 – present
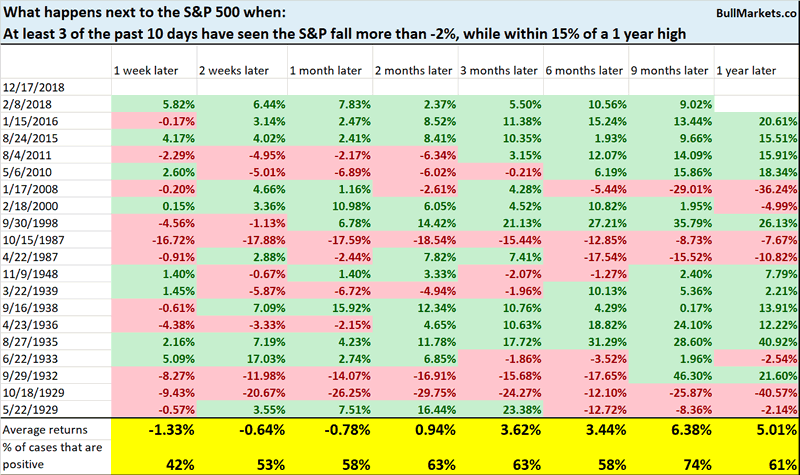
This has a slight bearish lean over the next 1 week.
Jeff Gundlach thinks that this is the start of a bear market
Jeff Gundlach thinks that this is the start of a bear market. Is he right?
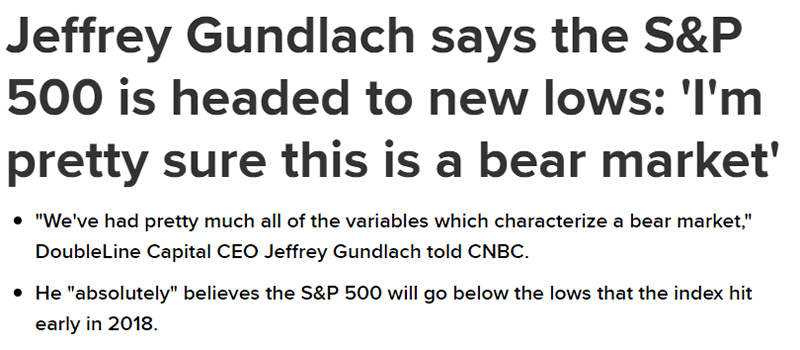
Right or wrong, it’s better to form your own stock market outlook. Jeff Gundlach is really good at predicting bonds. His stock and commodity predictions have over the years been no better than a 50/50 bet.
Never trade just because “so and so said to buy/sell”. Always look at the data and facts for yourself. If someone you follow is bullish/bearish, always look at WHY they are bullish/bearish. Focus on the reasons, and not who it’s coming from.
Click here for yesterday’s market studies
Conclusion
Here is our discretionary market outlook:
- For the first time since 2009, the U.S. stock market’s long term risk:reward is no longer bullish. This doesn’t necessarily mean that the bull market is over. We’re merely talking about long term risk:reward.
- The medium term direction is still bullish (i.e. trend for the next 6 months)
- The short term is a 50/50 bet
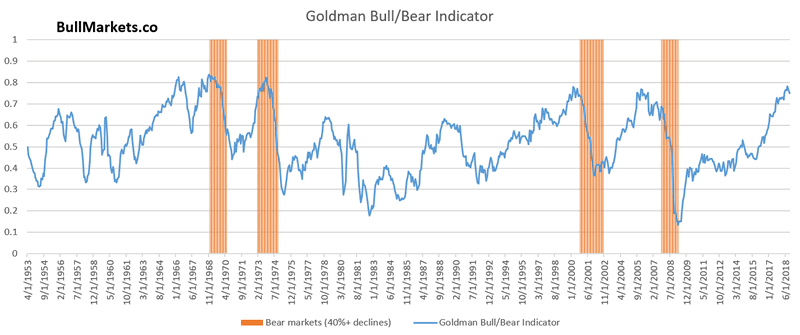
Goldman Sachs’ Bull/Bear Indicator demonstrates that while the bull market’s top isn’t necessarily in, risk:reward does favor long term bears.
Our discretionary outlook is not a reflection of how we’re trading the markets right now. We trade based on our clear, quantitative trading models, such as the Medium-Long Term Model.
Members can see exactly how we’re trading the U.S. stock market right now based on our trading models.
Click here for more market studies
By Troy Bombardia
I’m Troy Bombardia, the author behind BullMarkets.co. I used to run a hedge fund, but closed it due to a major health scare. I am now enjoying life and simply investing/trading my own account. I focus on long term performance and ignore short term performance.
Copyright 2018 © Troy Bombardia - All Rights Reserved
Disclaimer: The above is a matter of opinion provided for general information purposes only and is not intended as investment advice. Information and analysis above are derived from sources and utilising methods believed to be reliable, but we cannot accept responsibility for any losses you may incur as a result of this analysis. Individuals should consult with their personal financial advisors.
© 2005-2022 http://www.MarketOracle.co.uk - The Market Oracle is a FREE Daily Financial Markets Analysis & Forecasting online publication.