


Can The Markets Get Any Worse?
Stock-Markets / Financial Markets 2018 Dec 23, 2018 - 01:22 PM GMT

Supported by its Cycle Top at 21.96, VIX rallied above its Head & Shoulders neckline at 30.00 on Friday, closing above it. It is entirely possible that it could meet its target in the next week.
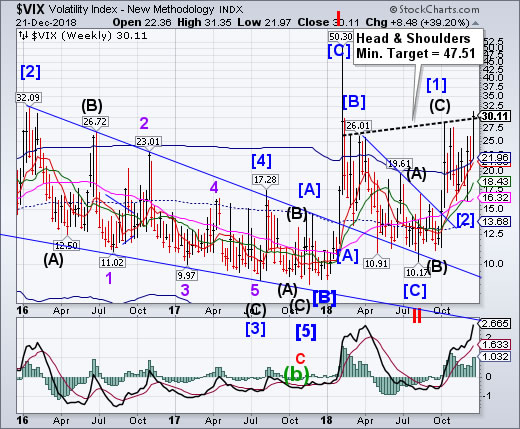
(Bloomberg) The days of low volatility are far gone, and recent tumult in the stock market has the VIX set for its biggest annual surge on record.
Not only that -- the S&P 500 Index has become more volatile than benchmark stock gauges of Asia, Europe and emerging markets:
- The Cboe Volatility Index has surged 157 percent this year, hitting 28.4 on Thursday, its highest level since the February equity rout.
SPX crosses the neckline, may also violate the 7-year trendline.
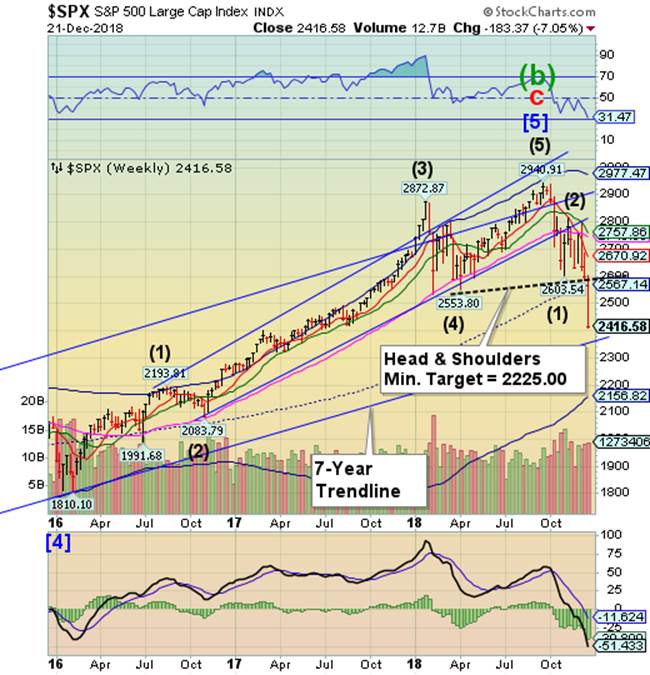
SPX crossed the Head & Shoulders neckline at 2585.00 this week, activating a decline toward the Cycle Bottom at 2156.82. Investor sentiment appears to be slow to change, as there has been little hedging or short selling to date, leaving few investors to buy at the lows. The Cycles Model still holds out for a decline through the year-end.
(Bloomberg) Volatility gripped financial markets a day after the Federal Reserve sent shock waves across assets, with the rising threat of a government shutdown adding to a litany of concerns buffeting equities. The dollar sank with crude oil.
The S&P 500 Index whipsawed throughout the day in heavy trading before closing at a 15-month low as investors debated whether the Fed set up the central bank for a policy error. Shares turned sharply lower after President Donald Trump hardened his demands in the showdown with Congress over funding the government. “I’ve made my position very clear -- any measure that funds the government must include border security,” the president said at White House event.
NDX Plunges through the Head & Shoulders neckline.
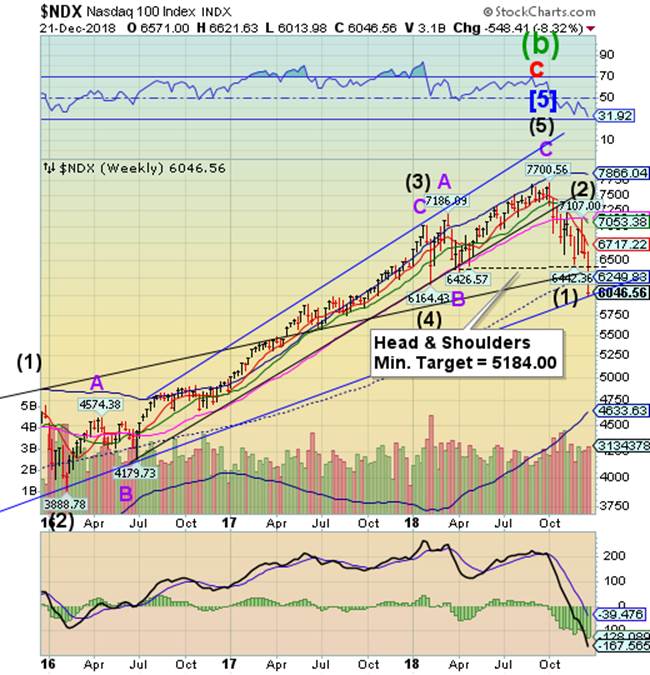
NDX plunged through the neckline of the Head & Shoulders formation on Wednesday, after the FOMC announcement and press conference. The decline stopped at the support offered by the 7-year trendline at 6000.00. Unfortunately, the trendline may not stop the decline, as the Head & Shoulders formation has been triggered with a high probability outcome.
(IBD) A 394-point intraday gain for the Dow Jones was looking good for the bulls early Friday after New York Fed President John Williams made some market-friendly comments. But it didn't take long for the bears to regain control in another volatile session.
FANG stocks like Netflix (NFLX), Amazon.com(AMZN) and Facebook (FB) endured another session of heavy selling as the Nasdaq composite fell 3%. It suffered a weekly decline of 8.4%.
The Dow Jones lost 1.8% and the S&P 500 gave back 2.1%. Volume was heavy due to the simultaneous expiration of index and stock futures and options. Known as quadruple witching, it only occurs four times a year.
The Dow Jones fell 6.9% for the week, its worst weekly decline since the financial crisis in 2008. The S&P 500 notched a weekly decline of 7%.
High Yield Bond Index falls beneath Long-term support.
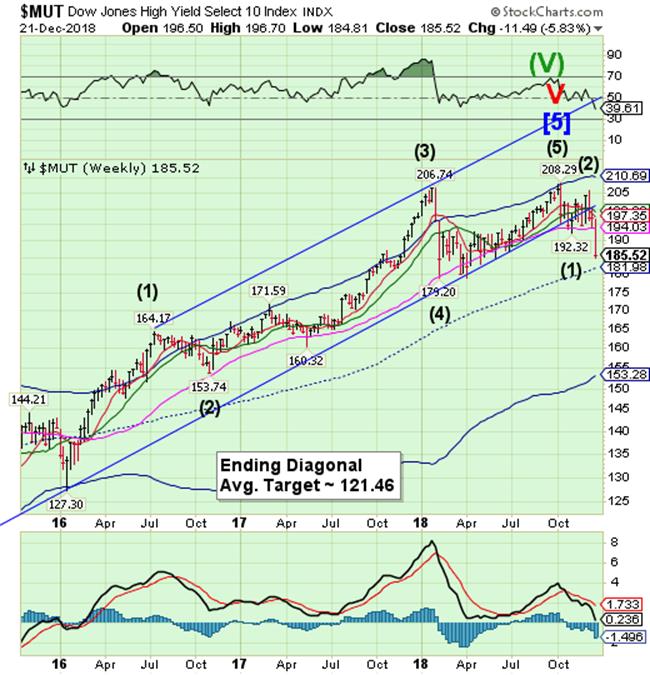
The High Yield Bond Index fell through a support that has been holding it up since the initial October sell-off. Until this week, MUT has been able to keep its gains for the year, despite being on a sell signal. Weekly mid-Cycle support at 181.98 may offer some relief, if it can stay above it. But the decline may not take a break for the holidays.
(Reuters) - A gauge of high-yield bond performance was trading close to its lowest since early 2016 on Friday, a day after the riskiest U.S. corporate bonds suffered their biggest daily drop in nearly three years and in sync with a broad pullback from stocks and other risky assets.
The iShares Iboxx High Yield ETF was down around half a percent in early afternoon trading and has fallen 7.2 percent so far this quarter, putting it on pace for its poorest quarterly performance since 2011.
UST rally is dampened by the Fed announcement.
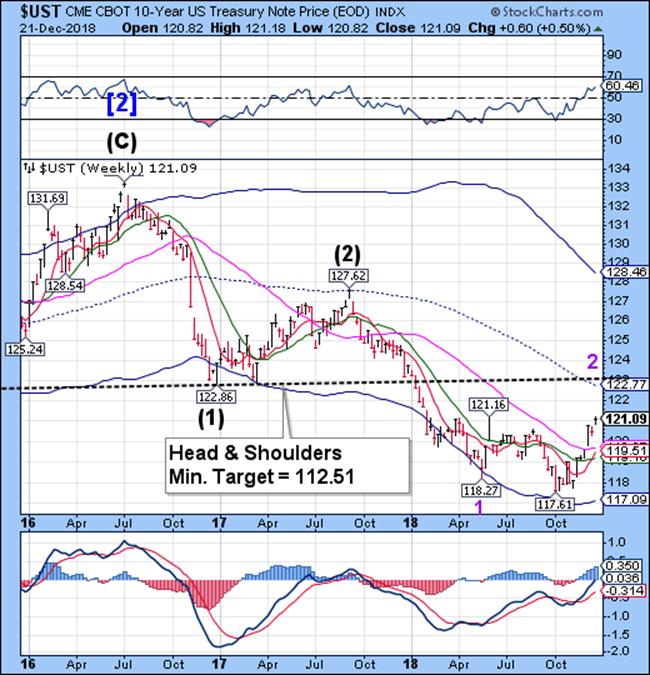
The 10-year Treasury Note Index rally stalled after the announcement by the Federal Reserve on Wednesday. UST appears to have hit its minimum target for this rally and the Cycles Model suggests waning strength next week. Should supports be broken, we may see treasuries tumble for up to 6 weeks.
(CNBC) U.S. government debt prices continued to edge lower on Friday morning, reversing a recent rally, as investors digest the fourth rate hike this year from the U.S. Federal Reserve.
The yield on the benchmark 10-year Treasury note climbed to 2.7956 percent by 4:30 a.m. ET with the yield on the 30-year Treasury bond rising to 3.0224 percent. Bond yields move inversely to prices
On Wednesday, the Fed announced an increase in its benchmark interest rate by a quarter point to a target range between 2.25 to 2.5 percent, in a widely anticipated move. It marked the fourth increase this year by the U.S. central bank and the ninth since it began normalizing rates in December 2015. Bond markets initially rallied after the hike, with equities slumping, but have edged lower since.
The Euro pushed back by mid-Cycle resistance.
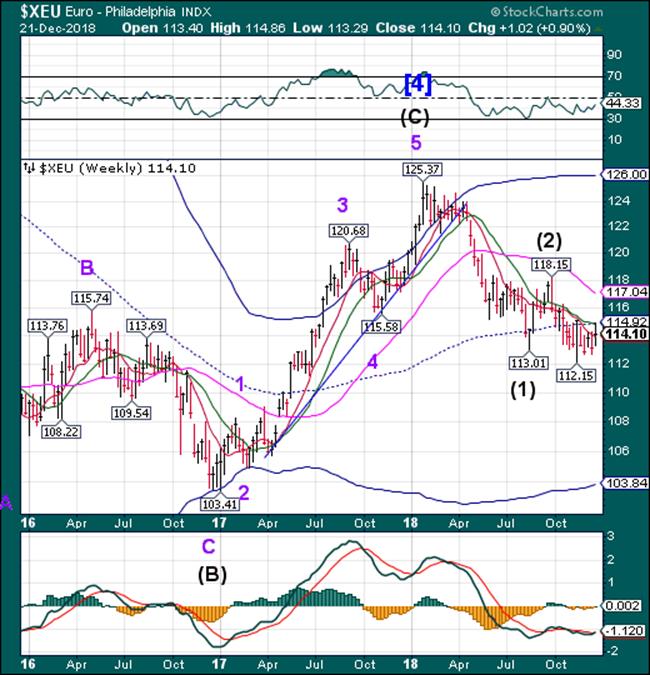
The Euro rally was repelled at mid-Cycle resistance at 114.92, but closed above Short-term support at 13.89. It continues on a sell signal despite the gains made this week. The Cycles Model suggests a possible attempt to go higher again next week, but it may not last.
(Bloomberg) Despite a flurry of disappointing data, the euro-area economy doesn’t necessarily face a bleak winter.
Hidden behind figures that point to a protracted slowdown -- such as yet another drop in German business confidence -- are a few encouraging signs. For European Central Bank President Mario Draghi, pay gains, rising exports and receding problems in the auto industry offer solace that the New Year might see the gloom lift a little, justifying policy makers’ decision to cap stimulus this month.
EuroStoxx retests the Cycle Bottom, goes lower.
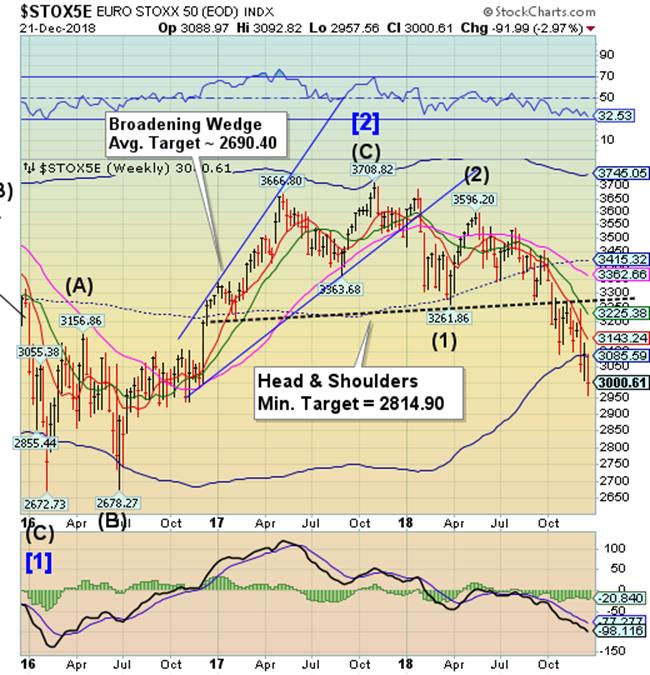
The EuroStoxx were held in check at the Cycle Bottom resistance early in the week. Since the Fed announcement it has gone lower, but has not met any of its targets. The Cycles Model may allow for an extension of the Cycle low for yet another week.
(Reuters) - European shares closed flat to slightly higher on Friday, recouping earlier heavy losses as comments from an influential U.S. policymaker soothed some concerns about rising borrowing costs and the threat of a U.S. government shutdown.
The pan-European STOXX 600 index closed up 0.03 percent, after testing lows not seen since November 2016 earlier in the session.
Still the index was on track for its worst month since 2016 amid lingering worries about slowing corporate earnings and economic growth.
.The Yen inverts the Cycle.
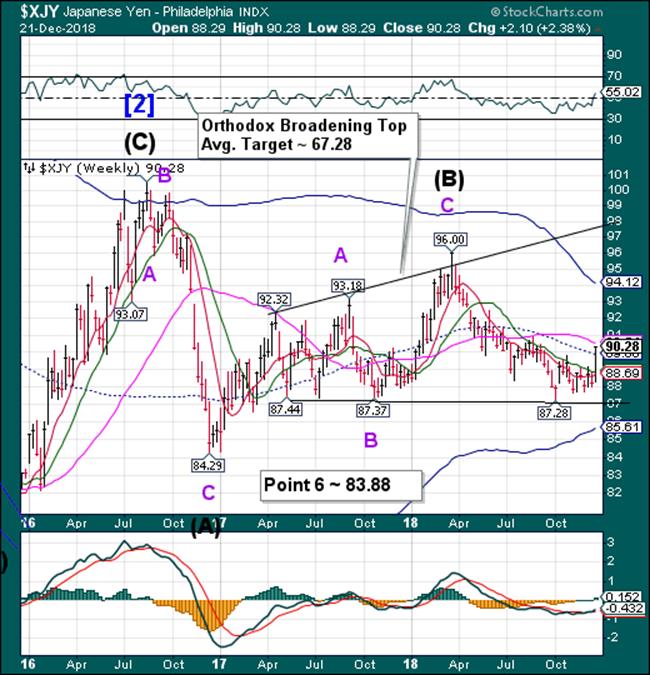
The Yen shrugged off its weakness to rally through Intermediate-term resistance, closing just beneath Long-term resistance. The inverted Cycle high made this week allows the Yen to stay elevated to the end of the month.
(Reuters) - The dollar languished close to one-month lows on Friday, seemingly pressured by year-end positioning with financial markets whipsawed by a collapse in oil prices, sell-off in equities and a threat of a U.S. government shutdown.
A day after the Federal Reserve raised policy rates and delivered an outlook that was less dovish than traders had anticipated, the liquidation of heavy long positions in the dollar in markets thinned by holidays seemed to be the only explanation for the dollar’s weakness.
The safe-haven Japanese yen benefited from the brittle sentiment. The dollar index against a basket of six major currencies stood at 96.421 after falling to 96.168 overnight, its lowest since Nov. 20. The index has lost roughly 1 percent this week.
Nikkei breaks through the neckline.
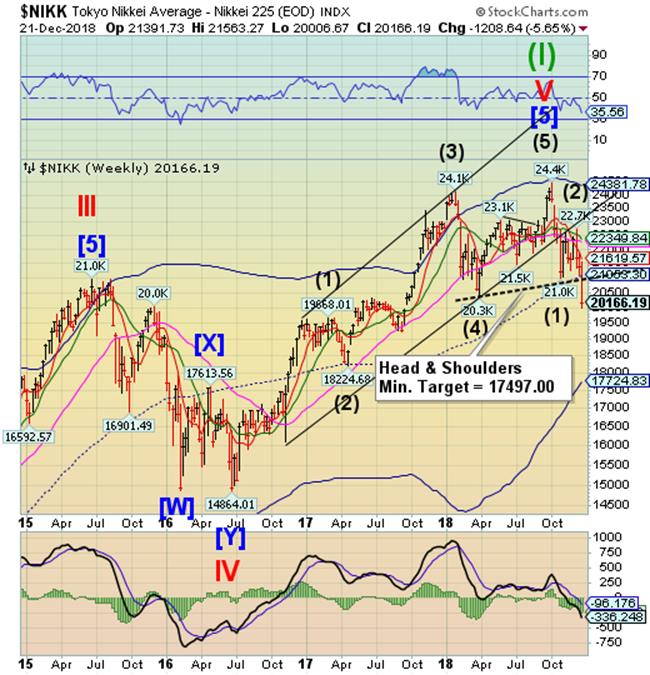
The Nikkei continued declining through the Head & Shoulders neckline on Monday, falling to its lowest level in 2018. The Cycles Model suggests that the delayed Master Cycle low may come by the end of the week.
(NikkeiAsianReview) Tokyo's Nikkei Stock Average is set to record its first annual decline in seven years, say fund managers and strategists, after the index closed down more than 11% on Friday, compared to the end of last year.
The chances of a rally strong enough to reverse the decline were looking unlikely just four trading days away from the end of 2018, analysts said. Other Asian stocks including China, Hong Kong and South Korea are not looking much brighter.
On Friday, the Nikkei average hit a new low for the year of 20,166 points, down 2598 points on the end of 2017, with investors losing confidence following the Dow Jones Industrial Average plunging to a 14-month low.
U.S. Dollar is testing support and resistance.
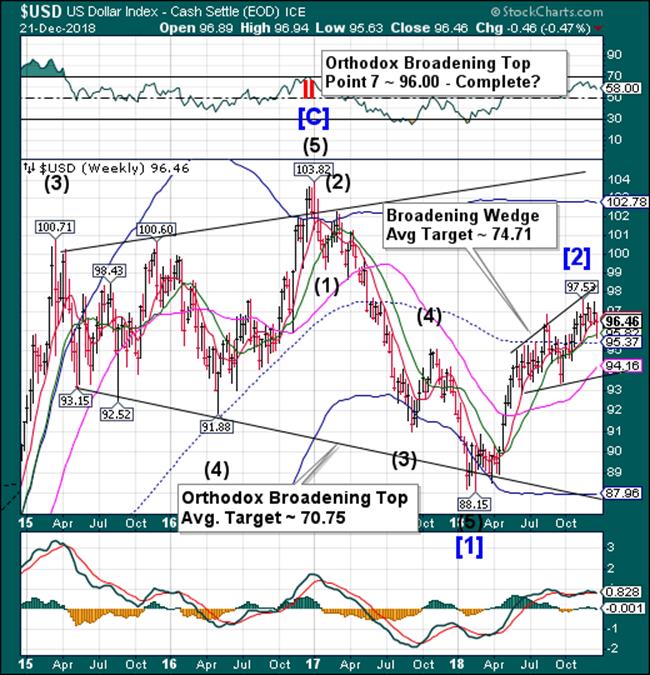
USD bounced from Intermediate-term support at 95.82 to retest Short-term resistance at 96.60 before closing beneath it. This is how an index reverses down through a well-established set of technical supports. The strong reversal took place this week, leaving the USD on a sell signal. .
(Reuters) - The dollar fell to a more than three-month low against the yen on Thursday, after the Federal Reserve signalled fewer interest rate hikes over the next two years and expressed caution about the U.S. economic outlook.
The dollar index, a measure of the greenback’s value against six major currencies, dropped to a one-month low.
Diminished U.S. rate hike expectations lessen the appeal of dollar-denominated assets.
Aside from lowering interest rate forecasts, the Fed also reduced growth and inflation expectations next year
.Gold tests Long-term resistance.
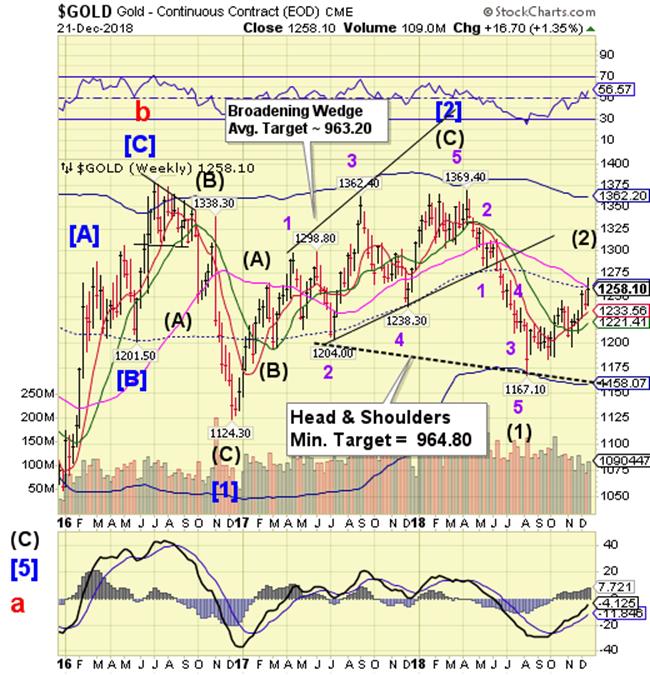
Gold challenged Long-term and mid-Cycle resistance at 1260.13 this week, but closed beneath them. The Cycles Model calls for another probe at the high before the end of the year. Gold may be extending the right shoulder of a potential Head & Shoulders formation before resuming its downtrend. While there is resistance at 1260.00, the Right Shoulder reaches perfect symmetry at 1275.00.
(Reuters) - Gold fell on profit-taking on Friday, a day after bullion touched a near six-month high and the dollar rebounded, but the metal stayed on track for a weekly gain as the appetite for risk waned.
Spot gold fell 0.4 percent to $1,254.81 per ounce at 2:04 p.m. EST (1904 GMT), after hitting its highest since June 26 of $1,266.40 on Thursday.
The yellow metal was, however, on course for a weekly gain of about 1.3 percent.
U.S. gold futures settled down 0.8 percent, at 1,258.10 per ounce.
Crude breaks through the trendline.
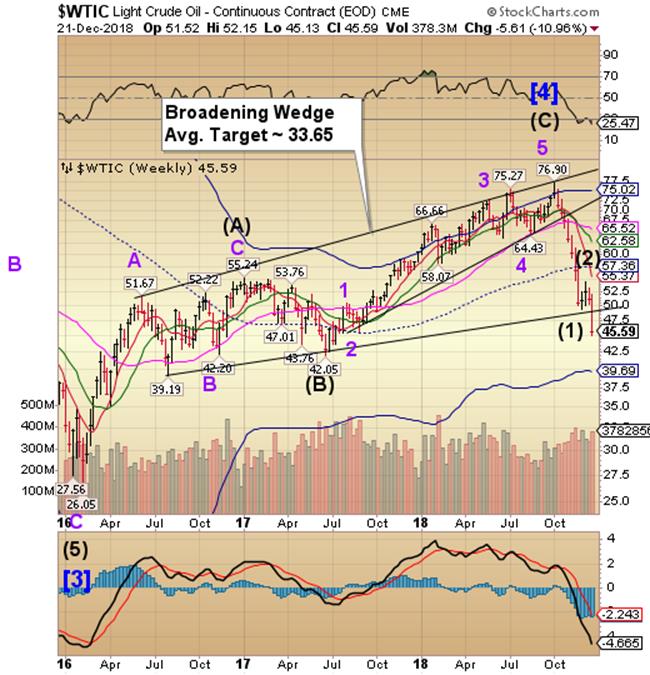
Crude oil broke through its Broadening Wedge trendline this week in an early Cycle failure. It is due for a bounce next week that may last from one to three weeks. The trendline is the first area of resistance. Should it not make it through the trendline on the bounce, the decline may resume through the end of January.
(CNBC) Oil prices extended this week’s sell-off on Friday, posting the worst weekly performance in nearly three years, as global oversupply kept buyers away from the market ahead of the long festive break.
U.S. West Texas Intermediate crude oil ended Friday’s session down 29 cents at $45.59, the lowest closing price since January 2016. WTI earlier fell to $45.13, its lowest intraday price since mid-July 2017.
Shanghai Index losing its grip beneath resistance.
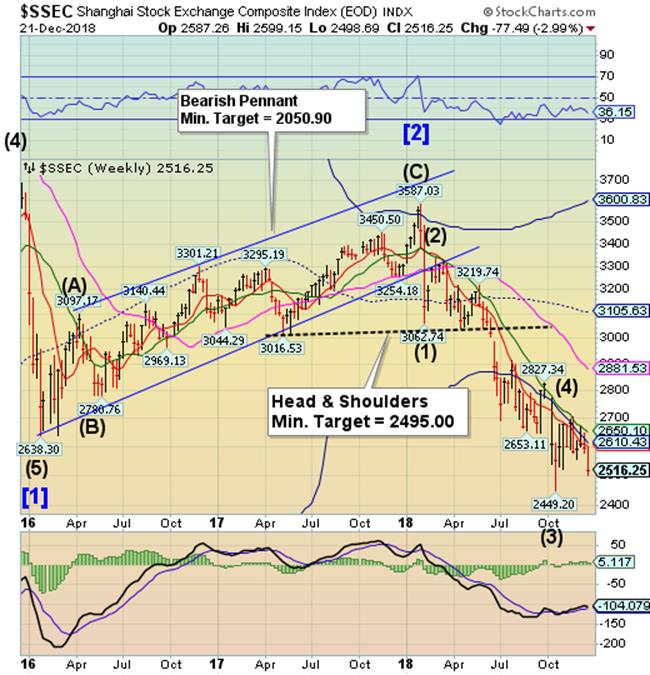
The Shanghai Index was repelled this week by Cycle Bottom resistance at 2610.43. The Cycles Model correctly anticipated further weakness through the end of the year and possibly extending into the New Year. It may continue with a potential bottom near 2000.00-2200.00.
(CNNBusiness) he recent turbulence in US stock markets pales in comparison with China's dismal 2018.
While the Dow and other major US indexes have plunged in recent weeks, the sell-off in China started much earlier and has been uglier.
The benchmark Shanghai Composite slumped into a bear market — a 20% fall from a recent high — in June. And things have gone further downhill since then. Hong Kong's Hang Seng, which is packed with big Chinese companies, followed Shanghai into bear territory in September.
China-focused investors have had plenty of bad news to contend with this year, including the country's economic slowdown and the trade war with the United States. China's economy is also laden down with debt and facing concerns about a real estate bubble and the stability of its currency.
The Banking Index reaches its Cycle Bottom.
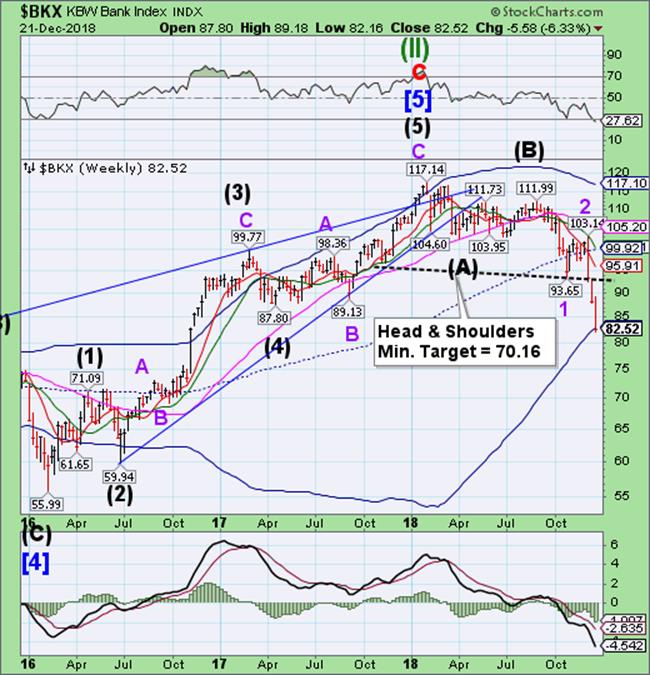
-- BKX continued its decline beneath the Head & Shoulders neckline at 93.00 to challenge the Cycle Bottom at 82.75 and close beneath it. The Liquidity Model suggests a possible total washout through the end of the year. The Cycles Model suggests the decline may meet the implied Head & Shoulders target.
(Bloomberg) A rout in the once-hot market for risky corporate loans has some of Wall Street’s largest banks stuck with at least $1.6 billion of unwanted leveraged buyout debt.
Banks including Barclays Plc, Goldman Sachs Group Inc. and Bank of America Corp. -- among the top providers of loans for LBOs -- have struggled in recent weeks to sell loans they’ve agreed to make for private equity deals, as concerns about the global economic outlook spurred investors to flee risky assets.
At least four loan sales for buyouts and acquisitions have failed to clear the market so far this month, forcing the banks to keep the debt on their books, according to data compiled by Bloomberg and people familiar with the matter. The hope is that by waiting until next year to sell the debt to investors the banks might be able to avoid a fire sale. But holding onto the loans could weigh on banks’ earnings in the fourth quarter.
(Bloomberg) Financial-market turbulence is supposed to be a good thing for Wall Street trading desks -- not so this quarter.
Banks are struggling to capitalize on tumult across stock, bond and currency markets, in part because many investors are staying on the sidelines as year-end approaches.
Another culprit: dramatic but short-lived swings in asset prices that are striking some of their clients hard, while also making riskier bets even more treacherous. Citigroup Inc. faces losses of as much as $180 million on loans to an Asian hedge fund, and Natixis SA took a 260 million-euro ($296 million) hit this quarter from equity-derivatives trades.
(ZeroHedge) In a year when hedge fund traders (or at least those of them who are still employed) expect double-digit raises despite the industry posting its worst annual return since 2011, one would think bankers, who didn't have the best year themselves (a paucity of deal flow, still-low interest rates and an inability to capitalize on volatile markets offset some of the profit boost from the Trump tax cuts) might hold out hope for a little extra thickness in those year-end envelopes (metaphorically speaking, that is).
For the most part, they won't be disappointed. As we pointed out last month, everyone at America's largest banks, from traders to underwriters to dealmakers will likely receive a larger bonus this year.
But offering some insight in to how the market downturn in the fourth quarter has already blunted these expectations, Bloomberg reported on Friday that bankers and traders in Morgan Stanley's institutional securities group should expect a bonus boost in the "low-to-mid" single digits.
(ZeroHedge) Dealer Behavior Leads Us To Another Big (Collateral) Warning
The latest liquidations began right after October 3. Oil shifted toward contango/crash, curves collapsed, even stock markets which looked like they had skated past disruptions early in the year were slammed. It was as if every market hit the same air pocket all at once, therefore identifying (global) liquidity as the major issue driven, of course, by reversing economic and risk assumptions. In other words, money dealers.
Usually in these situations we can identify telltale signs of that sort of pullback, places like repo meaning collateral. As has been the case for much of this year, there isn’t any indication of distress at least in domestic repo. In that one sense, the FOMC has it all wrong as they’ve tried to blame T-bill issuance for some of the money market distress still building up; according to repo fails anyway, contrary to the pleading of Powell the bill “deluge” is more likely to have helped than harmed.
Have a great weekend!
Tony
Our Investment Advisor Registration is on the Web.
We are in the process of updating our website at http://mrpracticalinvestor.com/ to have more information on our services. Log on and click on Advisor Registration to get more details.
If you are a client or wish to become one, please make an appointment to discuss our investment strategies by calling Connie or Tony at (517) 699-1554, ext 10 or 11. Or e-mail us at tpi@thepracticalinve4stor.com .
Anthony M. Cherniawski, President and CIOhttp://mrpracticalinvestor.com
As a State Registered Investment Advisor, The Practical Investor (TPI) manages private client investment portfolios using a proprietary investment strategy created by Chief Investment Officer Tony Cherniawski. Throughout 2000-01, when many investors felt the pain of double digit market losses, TPI successfully navigated the choppy investment waters, creating a profit for our private investment clients. With a focus on preserving assets and capitalizing on opportunities, TPI clients benefited greatly from the TPI strategies, allowing them to stay on track with their life goals.
Disclaimer: The content in this article is written for educational and informational purposes only. There is no offer or recommendation to buy or sell any security and no information contained here should be interpreted or construed as investment advice. Do you own due diligence as the information in this article is the opinion of Anthony M. Cherniawski and subject to change without notice.
Anthony M. Cherniawski Archive |
© 2005-2022 http://www.MarketOracle.co.uk - The Market Oracle is a FREE Daily Financial Markets Analysis & Forecasting online publication.