


Next Recession: Finding A 48% Yield Amid The Ruins
Interest-Rates / US Bonds Mar 22, 2019 - 06:33 AM GMTBy: Dan_Amerman

 In a previous analysis we examined how to create a 21% yield, as the incidental byproduct of the Fed's plans for the cyclical containment of recession.
In this analysis, we will deepen that examination and visually illustrate the financial mathematics that would create a potential 48% yield from what the Federal Reserve plans to do in the event of another recession.
This analysis is part of a series of related analyses, an overview of the rest of the series is linked here.
Step One: Turning Zero Percent Interest Rates Into A 21% Yield
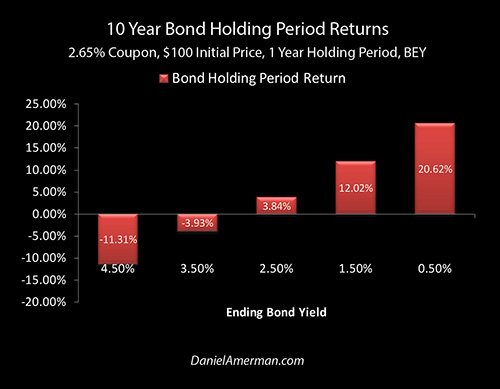
In the analysis linked here, we developed the graphic above, which shows how to create a strongly positive return from the combination of 1) a potential recession within the next one to two years; and 2) what we know with a high degree of certainty is likely to be the Federal Reserve response to such a recession, which is to immediately move Fed Funds interest rates back down to at least the zero percent range.
From the viewpoints of most investors this is a very bad combination, yet as we explored and can be seen in the rightmost red bar - this will also necessarily create some major profits, if we know where to look for them.
If we look at a one year holding period on a 10 year Treasury bond with a 2.65% coupon, then based upon the assumptions in that analysis and the 10 year yield moving to 0.50%, that strategy would indeed produce a 21% holding period return.
Reaching Out In Time For Greater Profits
In this analysis, we're going to go farther out in time, and explore how to take the same principles and turn them into a 48% yield.
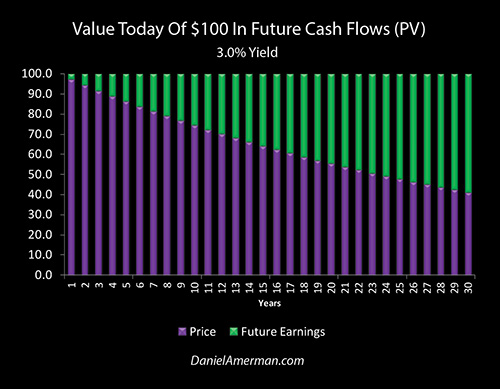
The graphic above is quite similar to the graphs used in developing the 21% yield, but it goes out 30 years in time instead of 10 years in time. What the graph shows is the value today of a $100 cash flow in each individual future year - 1 through 30 - assuming a 3% yield. The 3% yield is not random, but is approximately equal to current 30 year U.S. Treasury bond yields.
The price we pay today is the purple bar, and the green bar is the difference between the purple bar and the total amount of the future $100 cash flow, which will be our income. For a cash flow to be received one year out, the price we pay today is very close to our future cash flow, so our purple bar of price today (present value) is equal to $97.09, and our green bar of future earnings is equal to $2.91.
When we go out 10 years in time - the limit for a ten year Treasury bond - then in order to get a 3% yield on that individual cash flow, we would pay $74.41 today (the purple bar), and we would receive the remainder of the $100 as $25.59 in future income (the green bar).
However, what was the end point for a 10 year bond - is just where things start to get interesting for a 30 year bond (or other investment with a 10+ year horizon, such as a stock or REIT). Go out one more year - and the purple bar is already just a bit shorter.
When we go out 20 years, then the price we pay today for the 100 dollars in the future is a mere $55.37 - and our green bar of income is up to $44.63. If we go out 30 years - which is where most of the money is with 30 year bonds, when the principal is repaid at maturity - then we pay a price today of only $41.20, and our green bar of income is up to $58.80.
This form of present value analysis is a governing principle when it comes to investment prices and it is of critical importance for determining the value today of all future cash flows within all investment asset classes. We are looking at bonds because they are the simplest way of looking at this, there are the fewest "moving parts" so to speak, but variations of these same principles apply every bit as much to stock prices and real estate prices.
Pricing In The Fed Response To A Recession
Now, let's assume that the business cycle has not been repealed, and for the 35th time since 1854 (analysis link here), the cycle turns once again from expansion to recession.
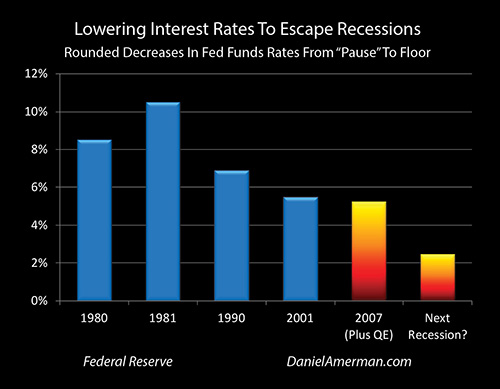
As previously developed (analysis link here), the Federal Reserve is currently caught in an interest rate trap of its own making, dependent on slamming down interest rates by an average of over 7% in the modern era in order to escape each recession in the last 40 years, but currently pausing its cyclical interest rate increases at under 2.50%, meaning it is has only about a third of the usual "ammunition" to work with. With so little room to work with, should the Fed find itself facing another recession, then it intends to go straight back to zero percent interest rates, and to likely supplement that by stacking still more trillions of dollars of quantitative easing onto its already swollen balance sheet.
Fed Funds rates are not 30 year bond rates, but for the purposes of this illustration we will assume that the combination of zero percent Fed Funds rates and early and aggressive quantitative easing focused on purchasing medium and long term Treasury obligations, are in combination enough to bring 30 year yields down to a round number of one percent.
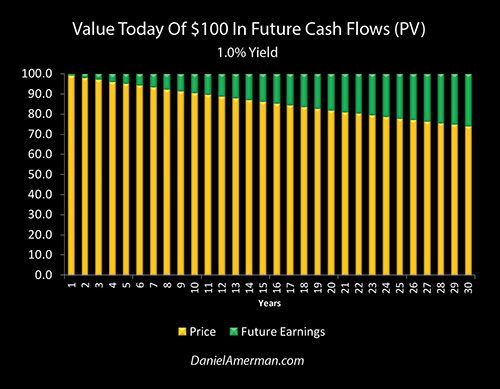
Let's revisit our 30 year price graph, but this time let's look at the new prices for each cash flow with a 1% yield. Those prices today are now represented by golden bars, instead of the purple bars of a 3% yield.
As is visually obvious - the golden bars are much taller than the purple bars. For a $100 cash flow ten years out, we now pay $90.53. For a $100 cash flow twenty years out, the new price we pay today is up to $81.95. With the 1% yield that is created by the Fed's desperately deploying zero percent interest rates and new rounds of quantitative easing in order to contain the crisis that could be associated with a new recession - then the golden bar in 30 years is all the way up to $74.19.
The Two Sources Of An 80% Gain
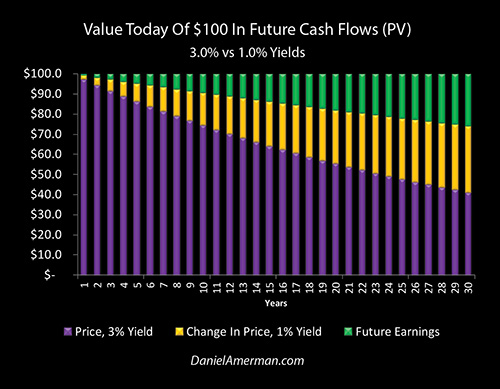
When we combine the previous two graphs, then we get the graphic above. The purple bars are the prices we pay for $100 in cash in each year with a 3% yield. The golden bars are stacked on top of the purple bars, and represent the increases in prices with a 1% yield. The green bars are what is left of the future earnings in each year, with that 1% yield.
As is visually obvious, the farther out that we go in time, then the greater the height of the golden bars - which means the greater the profits today. When we go out 10 years, going from a 3% yield to a 1% yield means that our price today increases by $16.12.
When we go out 20 years, then the increase in price today is $26.58. If we go out 30 years, then the increase in the price that we can sell that future cash flow for today is $32.99, and this profit is the direct result of the Federal Reserve's fervent attempts to exit recession while lacking the traditional tools to do so.
Something else that is visually obvious is that even while the heights of the golden bars of profits are growing each year, the purple bars of how much we have to invest to get those profits are shrinking. So each year we go out, we spend less money in order to make more money - and we should probably be taking that into account as well.
Starting with the price today of a $100 cash flow that is 10 years out, then we buy at $74.41 with a 3% yield, the price rises by $16.12 if the yield falls to 1%, and that is an increase of 22% on our investment amount. Not bad.
Now, for a cash flow that is 20 years out, we would buy at $55.37 with a 3% yield, and the price today would move to $81.95 with a 1% yield. That higher profit of $26.58 on the lower investment of $55.37 equates to an increase of 48% on our investment amount. That's getting to be a fairly decent return, for what many investors would consider to be a pretty bad situation.
When we go 30 years out, then the price today for a $100 cash flow at a 3% yield is $41.20, and that rises to $74.19 if rates go down to 1%. So, the economy tanks, most markets crash, the Fed goes into panic mode, it slams rates down to zero percent, even while it creates trillions of new dollars out of the nothingness in order to buy U.S. government debt, stacking those medium and long term bonds onto its balance sheet until it grows to a fantastic size - and we earn a quick $32.99 on a $41.20 investment, which is an 80% return. Hmm, that's an interesting number - under those circumstances.
It is also worth noting the 80% return figure applies to the principal that is returned at bond maturity in 30 years, and is therefore much more important than the price changes with the interim semiannual bond payments. For most people, moving from a 3% to a 1% yield may sound like a trivial movement between two low yields, with little profit potential - but the fundamentals which determine securities valuations show us a quite different picture.
As explored in the immediately preceding analysis in this series (link here), when the Fed radically changes the (effective) risk-free rate in the attempt to escape crisis, its heavy-handed interventions necessarily send the value of money flying through time, with some categories of investors being enriched even as others are impoverished. The farther out we go in time - the greater the Fed-induced redistribution of investor wealth.
Turning Fed Policies Into A 48% Yield
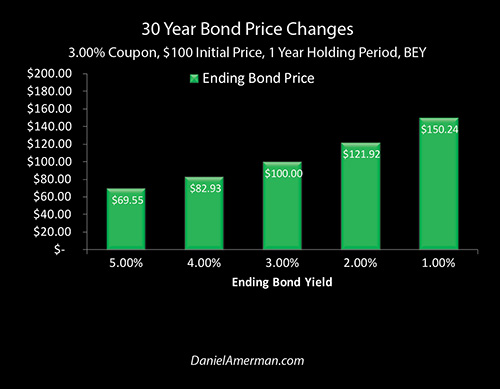
When we look not at the individual cash flows, but instead at the cumulative total of the price changes for each of the 30 years of 3% interest payments, as well as the return of principal at bond maturity, then we get the change in price for the bond itself. For a one year holding period, and moving to bond-equivalent yields (semiannual compounding), the dollar price on our now 29 year bond at an ending yield of 1% is $150.24.
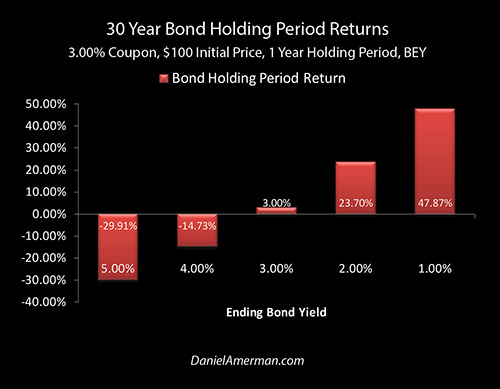
When we take into account the two interest payments that are made over that holding period (and we also look at the time value of money being discounted at a far higher rate than those interest payments), then our one year holding period return is 47.87%, which rounds to 48%. So, by going farther out in time we were able to take that remarkable holding period return of 21% with a ten year bond, and turn it into a 48% return by using a 30 year bond.
Fed Cycles Of Amplified Dangers & Opportunities
When most investors think about the possibilities of another cycle of recession and of a return to zero percent interest rates - they see a double negative.
There is very good reason for that perspective. The damage that a recession can do to employment and investment prices in most categories is bad enough. Zero percent interest rate policies over the seven years between 2008 and 2015 previously inflicted extraordinary damage upon millions of investors when it came to wealth creation and standard of living in retirement.
To have both negative factors hit at the same time - recession and a return to zero percent interest rates - would seem to be an example of Murphy's Law, the worst possible kind of luck.
However, there would be nothing "unlucky" or random about such a scenario. Slamming interest rates straight back down to zero percent is the main plan. The issue is that the nation - and all retirement investors - are still stuck inside of Fed-induced cycles of crisis and the containment of crisis.
The Fed took the unprecedented steps of zero percent interest rates and creating trillions of new dollars via quantitative easing, in order to contain the last crisis. It has not had the time or room to unwind those all the way yet, they appear to be the new starting point, particularly if there is indeed a recession within the next 1-2 years. From that starting point, a swift and quite likely prolonged return to (at least) zero percent interest rates seems to be almost guaranteed as a matter of Fed policy.
Those who would rather not think about Fed policy, and would rather invest for the hypothetical universe that much of conventional financial planning is (implicitly) based upon, where none of these issues exist - are likely to be savaged, and perhaps again and again with each iteration of these still amplifying cycles.
Each time, these investors will think it is another round of remarkably bad luck, when it will in fact be quite the reverse. What the Fed is doing is happening in plain sight, there are headlines in the financial media about one aspect or another just about every day, and these interventions have openly dominated the markets for more than a decade. Those who refuse to take these extraordinarily powerful market distorting interventions into account, are likely to personally pay the consequences in full, again and again.
However, if we can accept the reality of the situation, where a Federal Reserve caught inside of a trap of its own making is almost certain to be making massive market-distorting interventions with the next iteration of recession and the underlying business cycle - then we can look at this situation from an entirely different perspective.
The way that financial mathematics work, extraordinary profits will necessarily be created along with the extraordinary losses, and the key to financially surviving - and possibly financially thriving - is to understand where the non-random, artificially induced losses and profits are most likely to be found in each investment category, in each phase of the cycles, and how they can be at least partially seen in advance.
This analysis, in combination with a previous analysis, explored one such pocket of opportunity. In the 21% holding period return analysis, using a 10 year U.S. Treasury obligation, the fundamentals were illustrated. This analysis showed how to concretely take advantage of how a desperate Fed will move wealth through time, and a methodology was illustrated for bringing that yield up to 48% (based upon the assumptions used herein).
The graphic below is an organizational framework I created, to help explain how the changes in the cycles of crisis and the containment of crisis can change investment category results at various stages in those cycles.
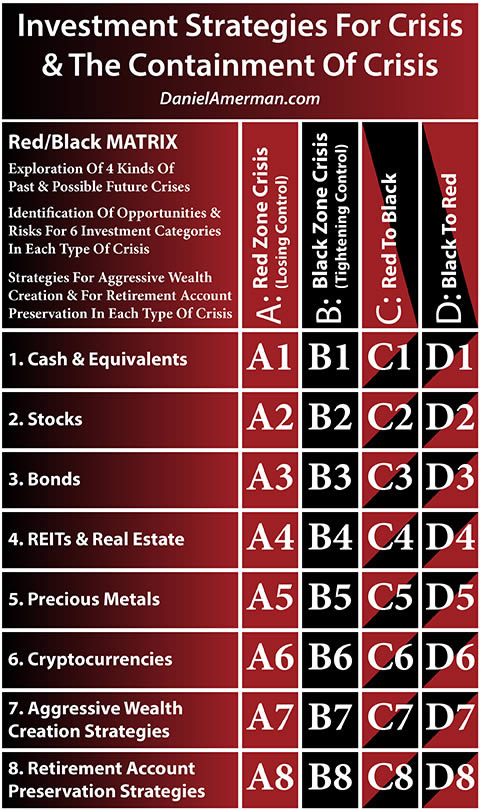
An explanatory analysis for the matrix is linked here.
In this case we have been further exploring matrix cell D3, which is the intersection of the D Black to Red column for the cycles, and the 3rd row, which is the investment category of bonds.
This is a real and viable opportunity - contingent upon the assumptions shown herein. That said, our last full cycle included not just record high prices for bonds - but record high prices for real estate and stocks as well. The 3rd row of bonds is a good place for learning, because of the relatively fewer variables, but if there is indeed another recession and another cycle of crisis, and if that is followed again by another cycle of the containment of crisis, then bonds will only be the appetizer. Most of the money will eventually likely be found - again - in rows 2 and 4, the main courses of stocks and real estate.
When most people think about a potential recession and a return to zero percent interest rates - all they see is a double negative. I hope that you found this analysis to be of interest in seeing how some highly positive opportunities can be identified as well.
Daniel R. Amerman, CFA
Website: http://danielamerman.com/
E-mail: mail@the-great-retirement-experiment.com
Daniel R. Amerman, Chartered Financial Analyst with MBA and BSBA degrees in finance, is a former investment banker who developed sophisticated new financial products for institutional investors (in the 1980s), and was the author of McGraw-Hill's lead reference book on mortgage derivatives in the mid-1990s. An outspoken critic of the conventional wisdom about long-term investing and retirement planning, Mr. Amerman has spent more than a decade creating a radically different set of individual investor solutions designed to prosper in an environment of economic turmoil, broken government promises, repressive government taxation and collapsing conventional retirement portfolios
© 2019 Copyright Dan Amerman - All Rights Reserved
Disclaimer: This article contains the ideas and opinions of the author. It is a conceptual exploration of financial and general economic principles. As with any financial discussion of the future, there cannot be any absolute certainty. What this article does not contain is specific investment, legal, tax or any other form of professional advice. If specific advice is needed, it should be sought from an appropriate professional. Any liability, responsibility or warranty for the results of the application of principles contained in the article, website, readings, videos, DVDs, books and related materials, either directly or indirectly, are expressly disclaimed by the author.
© 2005-2022 http://www.MarketOracle.co.uk - The Market Oracle is a FREE Daily Financial Markets Analysis & Forecasting online publication.